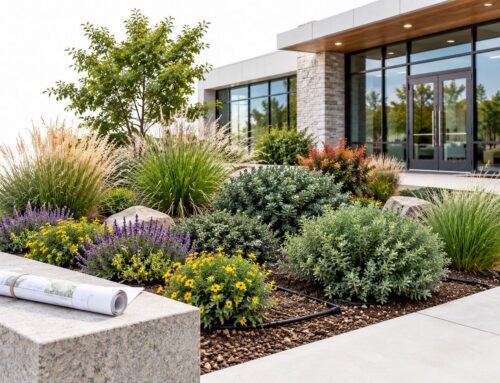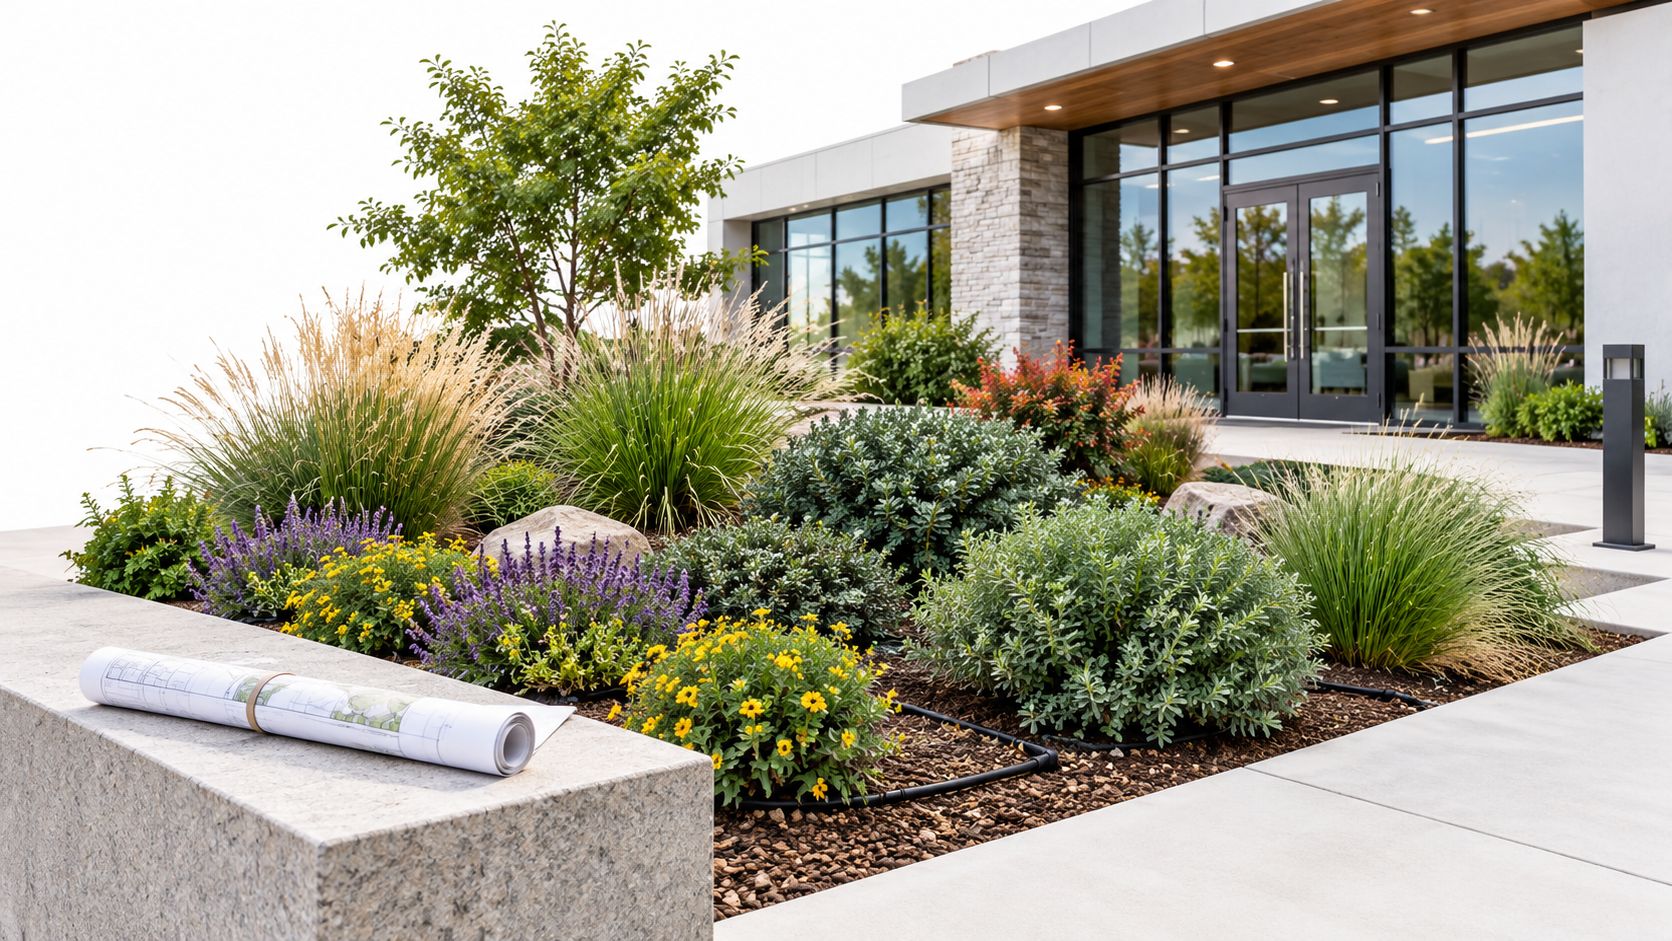
The irrigation calendar says a zone should run, but the scene tells a different story. Bermuda turf on a south-facing slope is thinning and showing stress, while beds beneath mature shrubs stay damp long after the last cycle. Meanwhile, the water invoice keeps climbing, and the irrigation crew is still adjusting runtimes by habit rather than by what is happening in the root zone.
That pattern is common across DFW office parks, retail centers, HOA campuses, and healthcare properties. Soil moisture monitoring provides the missing feedback signal. It shows whether a zone needs water, whether irrigation reached the intended depth, and whether a controller should run, pause, or trigger an inspection.
The practical objective isn't to collect attractive dashboard graphs. It's to establish site-specific thresholds for turf, beds, slopes, and shaded areas, then connect those thresholds to decisions people can execute.
Table of Contents
- Why Commercial Properties Need Soil Moisture Monitoring
- Placement Strategy for Turf, Beds, and Slopes
- Installation and Soil-Specific Calibration
- Wiring Sensors Into Controllers and Telemetry
- Turning Readings Into Irrigation Decisions
- Maintenance and Troubleshooting Playbook
- ROI and a Real Commercial Case Study
Why Commercial Properties Need Soil Moisture Monitoring
Fixed irrigation schedules fail because commercial properties rarely behave like uniform fields. A property may contain compacted turf beside a sidewalk, sandy imported soil in a renovated bed, clay-heavy native soil near a parking lot, and shaded planting areas that receive less evaporation but more competition from tree roots. One calendar cannot respond intelligently to all of them.
Time-based programming creates two problems at once. The exposed turf dries quickly and becomes stressed before the next scheduled cycle, while shaded beds receive water they haven't used. Runoff makes the imbalance worse on slopes. Water applied faster than the soil can absorb it moves downhill, leaving the upper contour dry and the low point saturated.
That creates a costly diagnostic trap. Staff see declining turf and increase runtime, but the extra water may only deepen saturation in another part of the zone. Property managers then face rising invoices, plant replacement requests, irrigation complaints, and service calls without a reliable way to connect the symptoms to root-zone conditions. A useful overwatering warning guide can help identify visible symptoms, but visual inspection alone doesn't reveal how moisture changes below the surface.
The operating shift from calendars to thresholds
A calendar answers, “When is this station allowed to run?” Monitoring adds the more important question, “Does this hydrozone need water now?”
The operating loop is straightforward:
- Measure the root zone. Place probes where the dominant plants draw water, rather than beside a valve or at the wettest sprinkler impact point.
- Define a wet and dry boundary. Use soil texture, plant type, rooting depth, slope, and seasonal behavior to establish when irrigation should pause or begin.
- Connect the reading to a controller action. A wet zone can skip a cycle. A zone between thresholds can follow its baseline program. A dry zone can receive a refill cycle, subject to runtime and runoff limits.
- Inspect exceptions. A sudden dry reading may indicate a broken lateral, blocked head, poor probe contact, or a true plant-water deficit.
This approach matters most on heterogeneous properties because it replaces assumptions with local evidence. It also separates irrigation management from plant appearance. By the time turf visibly declines, the root zone may already have been depleted, while yellowing beds may reflect saturation, poor drainage, or root damage rather than a lack of water.
Choosing the sensor family
Commercial teams typically compare capacitive probes, time-domain reflectometry sensors, and tensiometric units. Each measures a different aspect of soil-water behavior and carries a different field burden.
| Sensor Type | Best Fit on Site | Strengths | Limitations |
|---|---|---|---|
| Capacitive | Broad turf grids where deployment cost matters | Affordable, easy to integrate, suitable for distributed monitoring | Readings can drift in high-salt or high-clay profiles without local calibration |
| Time-domain reflectometry, or TDR | Clay-heavy sites where defensible volumetric water content matters | Strong accuracy potential across recalibrated soils, better tolerance of difficult profiles | Higher per-unit cost and more involved interpretation |
| Tensiometric | Shrub beds and tree zones where plant-available water drives decisions | Measures soil water potential, which relates directly to the effort roots need to extract water | Requires service and is less convenient in turf applications |
Factory calibration isn't a dependable substitute for site calibration. A review found factory-calibrated sensor accuracy commonly around 0.03 to 0.04 cm³/cm³, while soil-specific calibration could improve accuracy to about 0.01 cm³/cm³ or better, with performance affected by salinity and clay content (review of soil moisture sensor calibration).
For a large turf network, capacitive probes may provide the coverage a budget can support. For a clay-dominant profile where the number must withstand scrutiny, TDR can justify its added cost. In planting beds, tensiometric readings may be more useful than a percentage moisture value, provided the maintenance routine is realistic.
Placement Strategy for Turf, Beds, and Slopes
Sensor placement determines whether the data represents a hydrozone or merely represents the spot where someone happened to dig. Start with the dominant plant, active root depth, and water movement. A probe at a sprinkler head's low-elevation drip point will often report the wettest location, not the location that controls irrigation success.
For turf, place stations in the driest third of the rotor zone, at the active root depth. A four-to-six-inch installation depth is a practical starting point for many maintained turf areas, but the final depth should match actual rooting and soil conditions. Avoid placing the probe directly beside a head, along a curb where runoff collects, or in a strip altered by foot traffic.
Beds need a different reference point. Install near the shrub root zone beneath the canopy dripline, not at the trunk and not against the bed edge. Tree-root competition deserves its own station when mature trees pull moisture from nearby ornamentals.
Slopes should be represented at the upper and middle contours. The upper slope often dries first, while the lower section may collect runoff and remain wet. Shaded edges beside buildings also need separate consideration because reduced sun exposure changes dry-down, while walls, roof runoff, and tree roots can create unusual moisture patterns.
Practical rule: Two well-placed sensors per hydrozone will usually tell you more than six probes installed in convenient but unrepresentative locations.
Use a wet location and a dry location when the zone has clear variability. The purpose isn't to create a dense map. It's to capture the points that define when the zone needs attention and when additional water would create damage.
Installation and Soil-Specific Calibration
A sensor that has poor soil contact can produce convincing but useless data. Installation needs to create the same conditions around the probe that exist around nearby roots.
Use a controlled field sequence
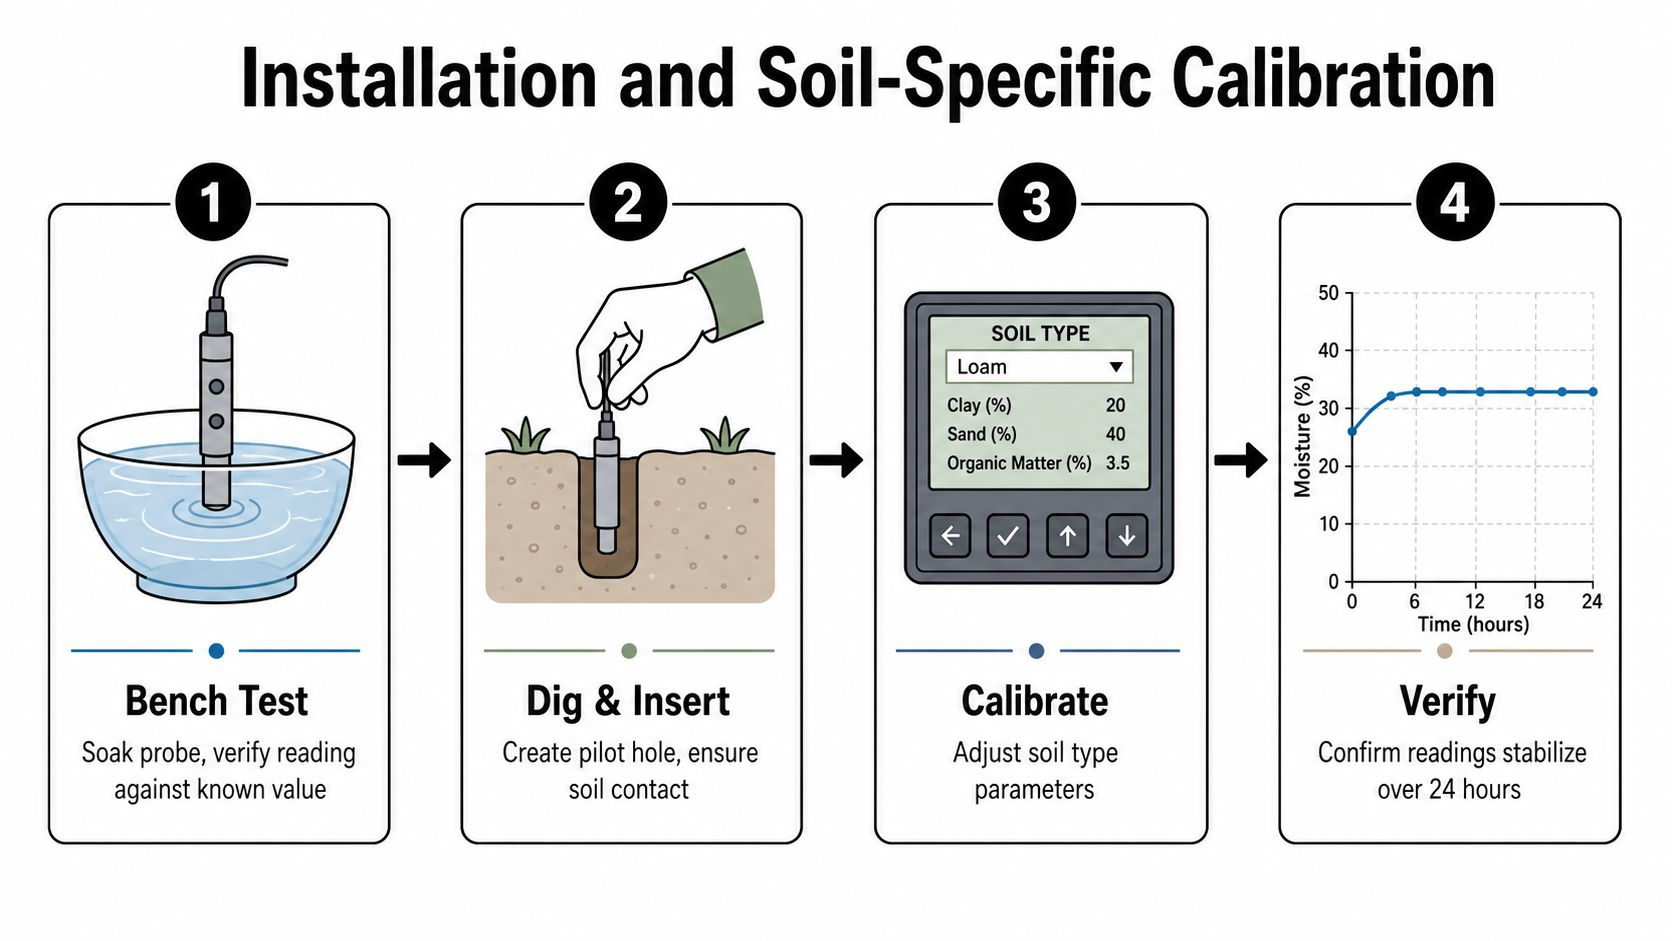
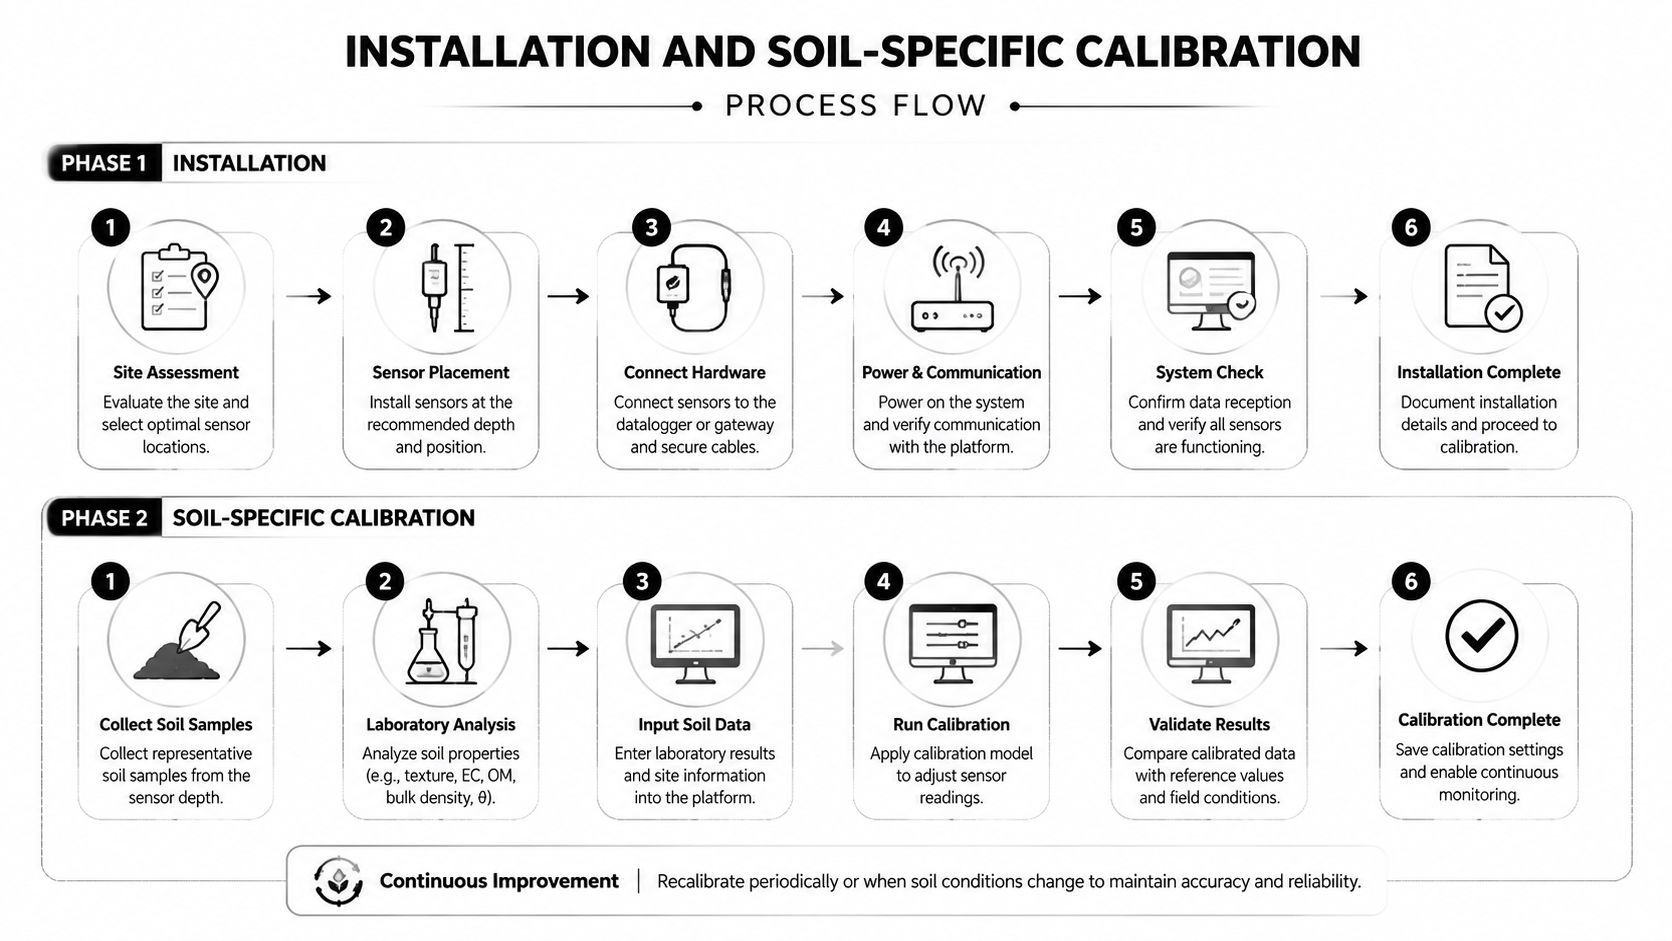
Begin with a bench check. Soak the probe, confirm that the reading responds consistently in a known water condition, and record the baseline against the manufacturer's calibration curve. The point is to catch a defective or unstable unit before a crew buries it in a high-value area.
In the field, use a soil probe or auger to create a clean profile to the active root depth. Avoid forcing a probe into an undersized or irregular hole, because air gaps distort the electrical environment around the sensor. Reinsert the unit with full soil contact, then backfill carefully in compacted lifts rather than leaving loose soil around the sensing area.
Calibration must follow the soil, not just the product label. A 2026 field study of low-cost capacitive sensors found that laboratory-derived calibration produced field RMSE values of 0.055 to 0.191 m³/m³, while soil-specific field calibration reduced RMSE to 0.005 to 0.036 m³/m³. A simplified one-point calibration still produced improvement, with RMSE values of 0.006 to 0.078 m³/m³ (field study of capacitive sensor calibration).
Document the conditions that affect interpretation
Use the manufacturer's equation as a starting point, then apply a field correction using representative wet and dry conditions for that zone. Validate readings through a complete irrigation and dry-down cycle before closing the trench or treating the sensor as a control input.
Record the zone number, sensor serial number, installation depth, soil texture, plant community, slope position, and nearby abnormalities. That record turns a future troubleshooting call into a controlled comparison. Without it, a technician may recalibrate a healthy sensor just because its value differs from a probe installed in another soil.
Wiring Sensors Into Controllers and Telemetry
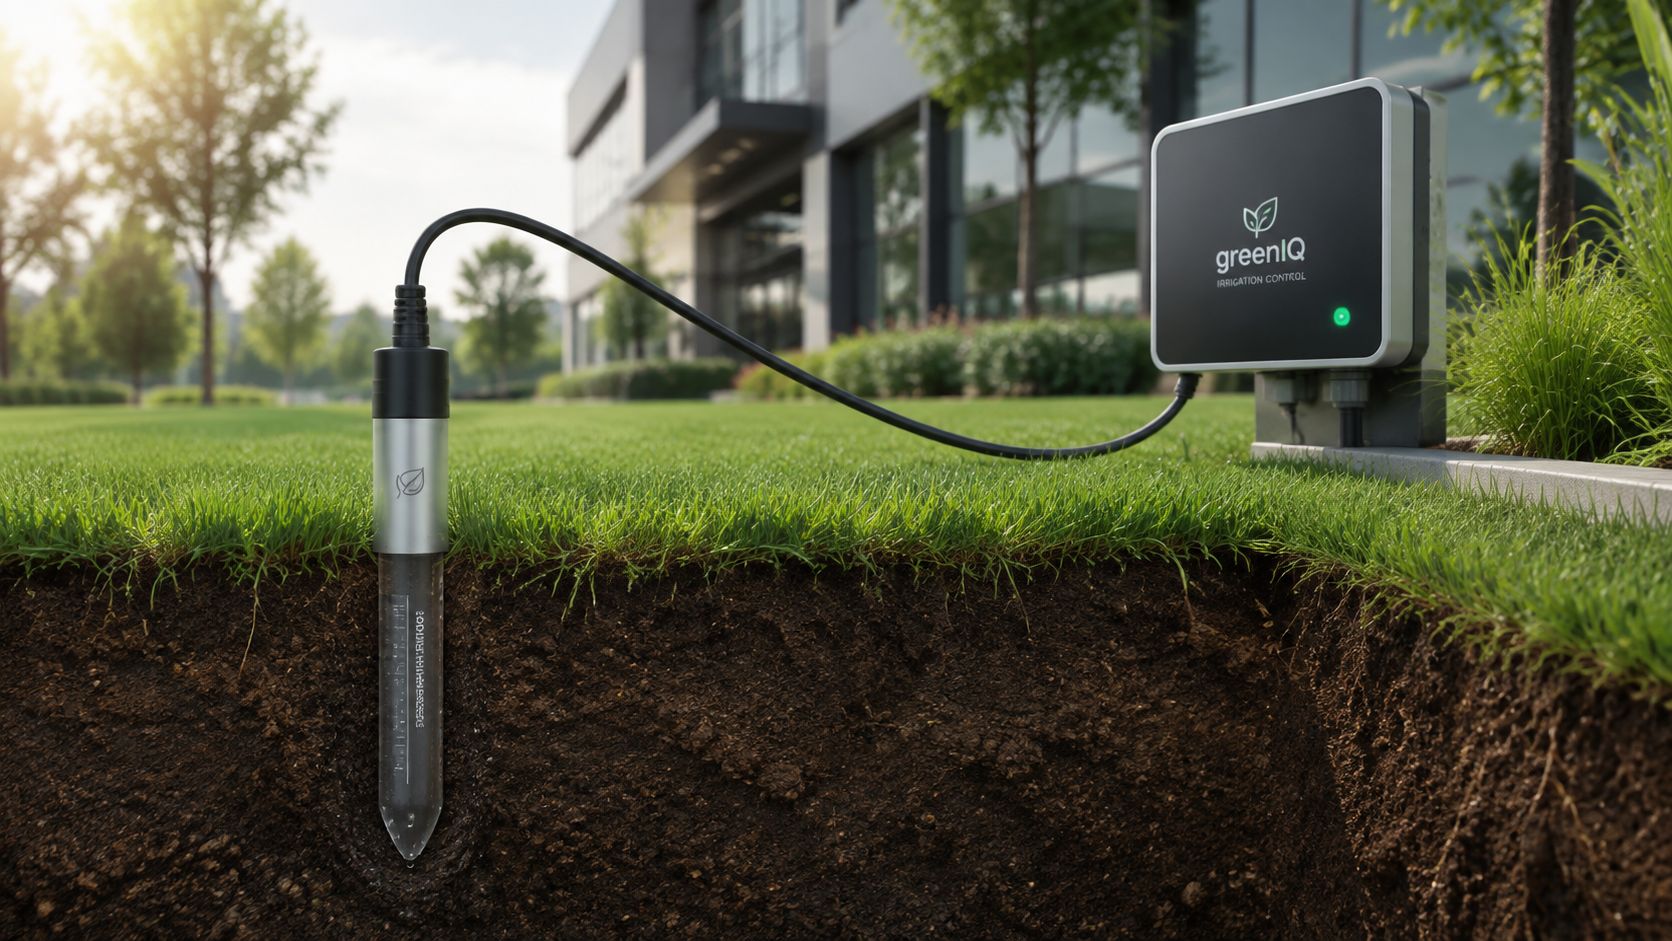
The network becomes operational only when the controller knows which reading belongs to which station. Connect each probe through its supported protocol, such as SDI-12 or analogue wiring, and protect exposed equipment at the valve box with surge protection. Open turf and isolated controller locations are vulnerable to electrical damage, so physical protection deserves the same attention as software configuration.
Map every sensor to the matching station number in the central control platform. Then test the polling interval, device heartbeat, and lost-sensor alarm before enabling automated responses. A reading that appears on a dashboard but isn't tied to the correct station can cause the controller to skip the wrong zone, which is worse than having no automation.
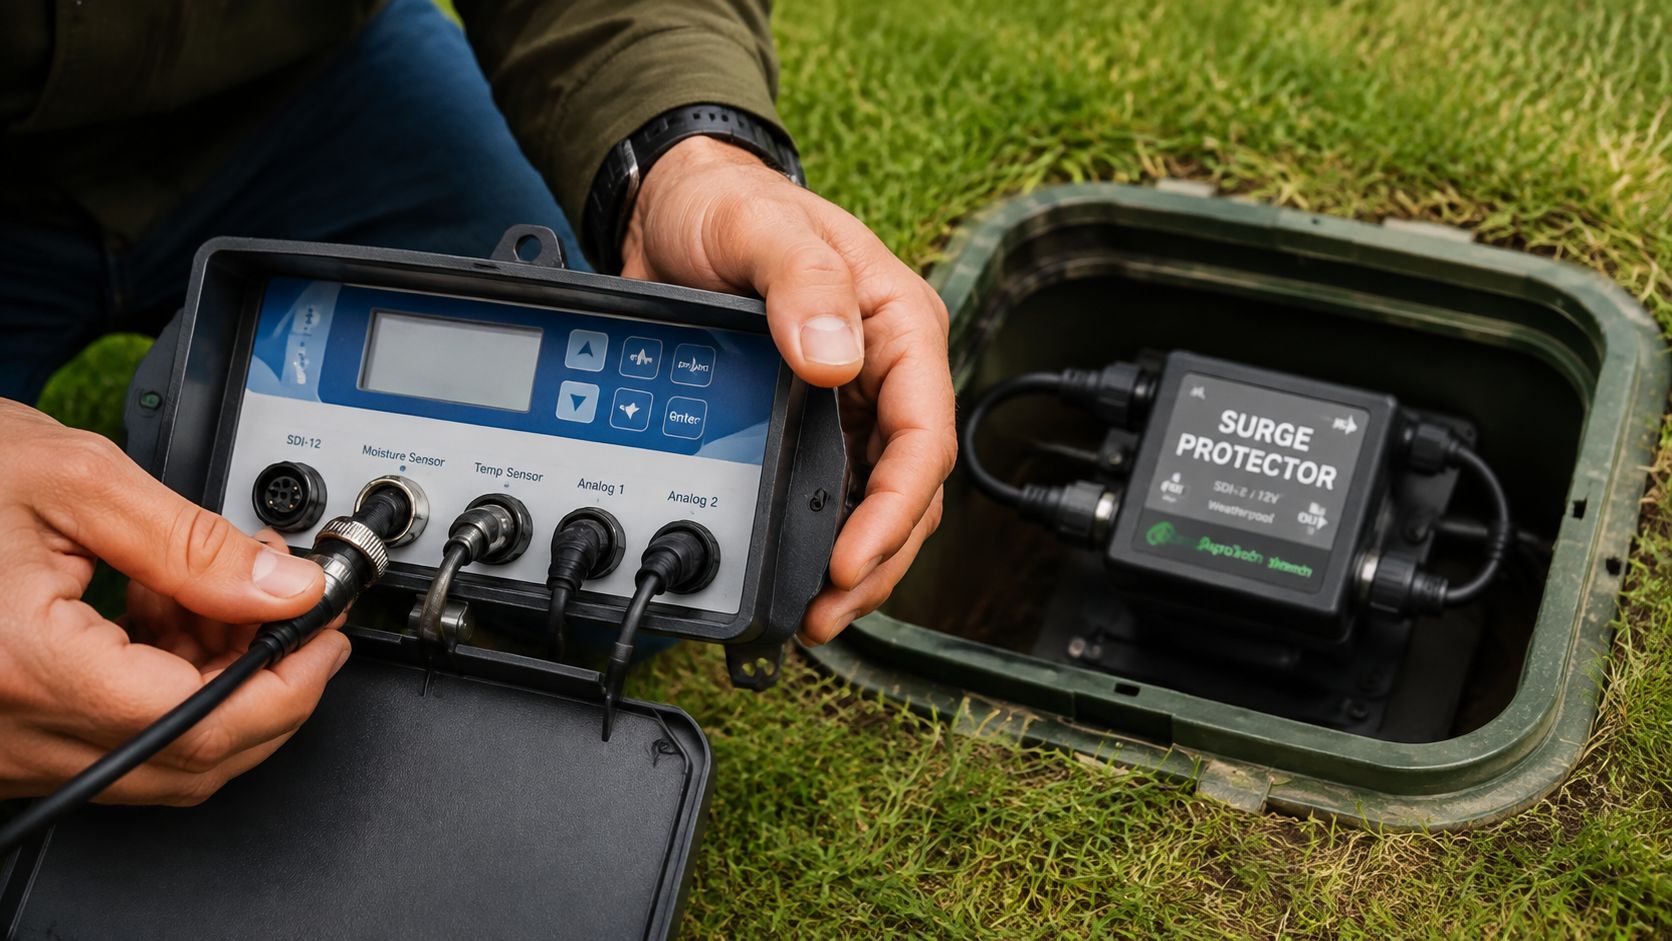
A useful dashboard should show the current value, recent trend, station identity, and status band. Raw numbers force the on-call irrigator to interpret every alert from scratch. Banded status makes the action visible:
- Dry, action required: Inspect the zone and schedule a refill cycle if the reading is valid.
- Normal: Maintain the baseline program and watch the trend.
- Saturated or fault: Skip irrigation, check drainage, or investigate the sensor and communications path.
Two-way control is the important step. If moisture remains above the wet threshold, the controller should skip the next scheduled cycle. Once the reading reaches the refill point, normal scheduling can resume, subject to weather, runoff, and site restrictions. Route critical dry and fault alerts to both email and SMS so the information reaches the person who can dispatch an irrigation technician.
Turning Readings Into Irrigation Decisions
A moisture percentage has no universal meaning across a commercial property. The same reading can represent very different plant conditions in sandy loam and clay because each texture stores and releases water differently. Set thresholds from field capacity, plant stress risk, root depth, and observed dry-down, then keep the logic local to the hydrozone.
For each zone, define a wet threshold just below the point where drainage and aeration become concerns. Define a dry threshold with enough margin to refill before plants show visible stress. In clay-heavy North Texas soils, that margin matters because adding water too quickly can create runoff or extend saturation instead of improving root-zone availability.
The table below is a decision framework, not a universal lookup chart. The verified material provides texture relationships, but commercial teams should confirm field capacity and dry limits with site sampling and plant response rather than copying one number across every zone.
| Soil Texture | Field Capacity (VWC %) | Dry Threshold (VWC %) | Wet Threshold (VWC %) | Typical Cycle Adjustment |
|---|---|---|---|---|
| Sandy loam | Site-specific | Set above the stress boundary | Set below saturation risk | Refill sooner with shorter, more frequent cycles |
| Loam | Site-specific | Set from observed root-zone depletion | Set below field-capacity risk | Use baseline cycles with moisture-based skips |
| Clay loam | Site-specific | Set conservatively above plant stress | Keep below prolonged saturation | Use slower application and longer dry-down windows |
| Clay | Site-specific | Confirm through field calibration and plant response | Keep well below saturation risk | Reduce runoff with cycle-and-soak and strict caps |
Use deficit-based control rather than a rigid day-of-week schedule. If a zone reads above its wet threshold, skip the next run. If it sits between thresholds, use the standard runtime. If it crosses the dry threshold, add a defined runtime adjustment within a hard cap, then inspect the zone if it remains dry.
ET should be a secondary check, not the primary trigger. Track the ratio of skipped cycles to completed cycles each month, then review whether thresholds still make sense as roots deepen, canopy cover changes, and seasonal demand shifts. For a broader operational perspective on water use and irrigation economics, SteadStack's guide to irrigation profit offers useful context. Commercial teams can also compare this approach with smart water management principles.
Maintenance and Troubleshooting Playbook
Monitoring networks fail in ordinary ways. Rodents chew cables, connectors loosen, probes corrode, air pockets form around an installation, batteries weaken, and valves respond more slowly than the controller log suggests. A maintenance program keeps those faults from becoming system-wide failures.
Keep a recurring inspection rhythm
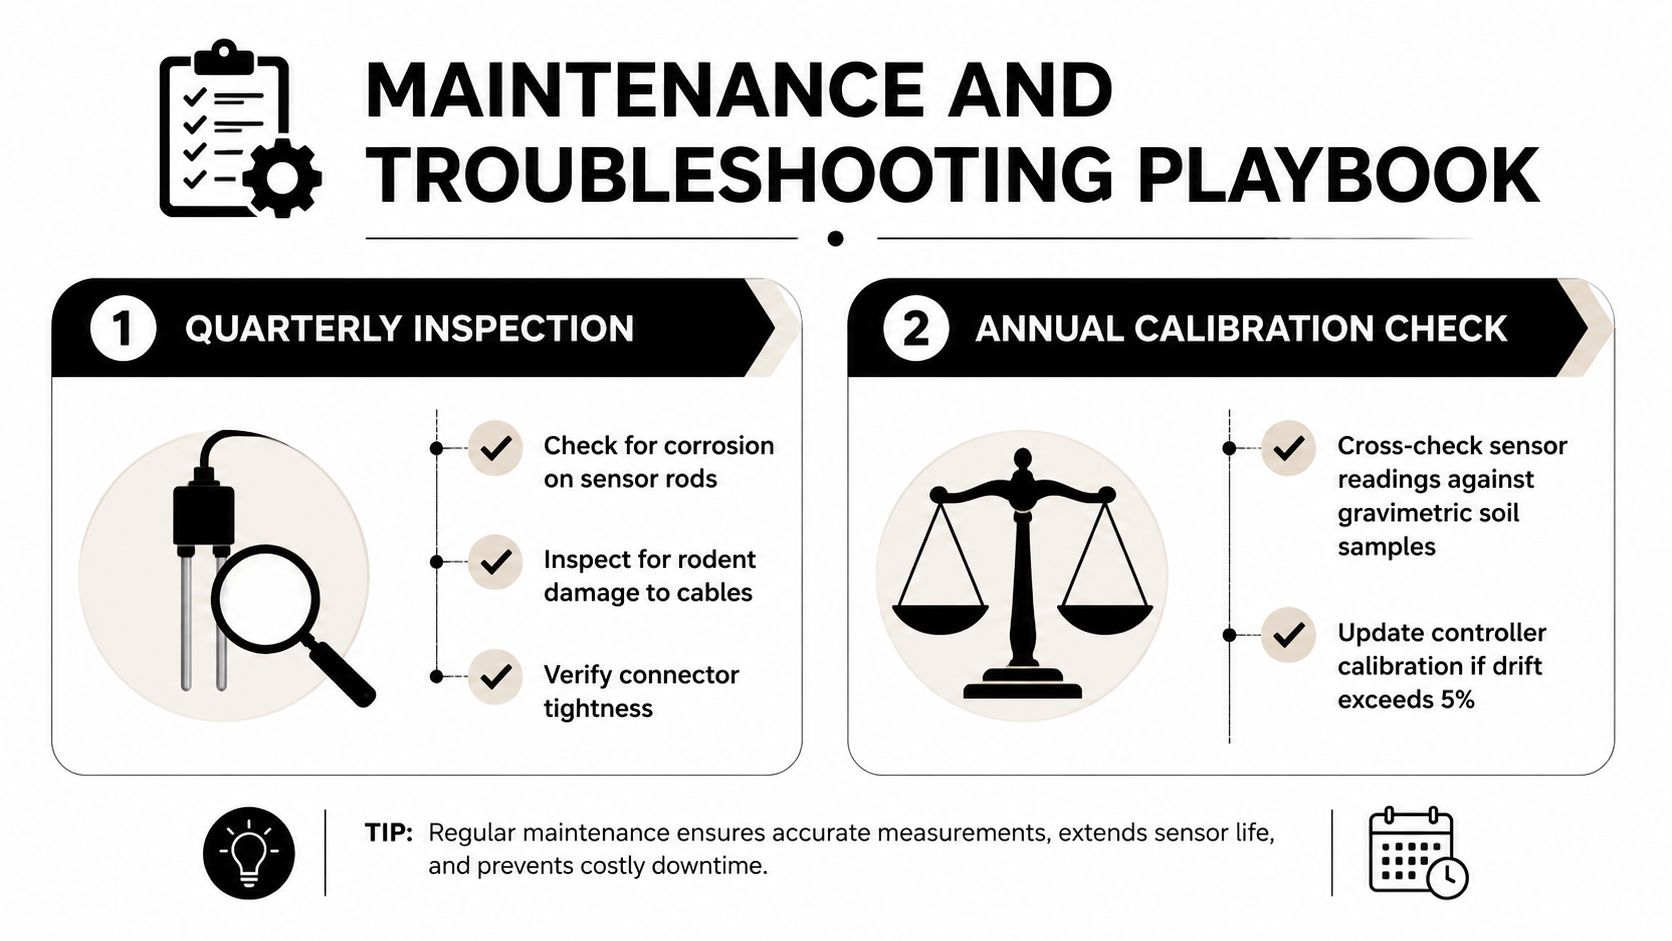
Inspect probes and connections quarterly. Look for corrosion, rodent damage, disturbed soil, loose connectors, and signs that a probe has shifted. Before peak irrigation demand, review firmware, battery condition, communication status, and alert routing. Test valve lag by comparing the controller command with actual field shutoff.
Cross-check the network annually against gravimetric soil samples from representative zones. This is a verification exercise, not a reason to recalibrate every sensor automatically. If a reading has drifted, determine whether the soil profile changed, the probe lost contact, or the electronics are failing.
Triage the fault before replacing equipment
| Symptom | Likely Causes | First Check |
|---|---|---|
| Flatlined reading | Failed probe, severed cable, inactive telemetry | Test power, connection, and local probe response |
| Sudden dry zone | Broken lateral, blocked head, air gap around probe | Inspect irrigation delivery and probe contact |
| Sudden saturated reading | Stuck solenoid, runoff, displaced probe | Check valve operation and site drainage |
| Dashboard value missing | Communications fault or mapping error | Confirm heartbeat and station assignment |
| Controller skips irrigation incorrectly | Wrong threshold or station mapping | Compare controller logic with the zone record |
Replace a sensor when the hardware fails or readings remain unstable after contact and wiring checks. Recalibrate when the device responds consistently but no longer matches field samples. During pre-summer startup, verify every alert and valve response. During mid-summer stress checks, compare the driest and wettest stations. Before winterization, protect exposed equipment and document anything scheduled for replacement.
ROI and a Real Commercial Case Study
A defensible business case starts with costs the property already understands. Measure water cost per thousand gallons, labor spent investigating irrigation complaints, plant and turf replacement exposure, service-ticket volume, and management time spent reviewing schedules. Then compare those costs with sensors, installation, calibration, telemetry, controller integration, maintenance, and staff training.
The requested representative case describes a 28-acre Class A office park in North Texas, with 14 controllers, 42 zones, and 24 sensors installed over three phases. Its reported results include a 34% reduction in water use during year one, irrigation-related service tickets falling by half, Bermuda turf recovery scores improving from C+ to A- on shaded berms, and payback at month 14. Those figures belong to the supplied case framework, not to a general industry benchmark.
| Metric | Before | After 12 Months |
|---|---|---|
| Water use | Baseline calendar-driven consumption | 34% lower |
| Irrigation-related service tickets | Baseline ticket volume | Half the previous volume |
| Bermuda turf on shaded berms | C+ recovery score | A- recovery score |
| Payback | Not achieved | Month 14 |
The result is plausible operationally because the system addresses several costs at once. Moisture thresholds can prevent unnecessary cycles, expose dry zones before turf declines, and give technicians a faster way to distinguish irrigation delivery problems from plant or soil problems. A property that also improves head performance, repairs leaks, and uses appropriate cycle-and-soak programming can capture more value than one that installs sensors but leaves the underlying hydraulics untouched.
The caveat matters. Payback stretches on properties that already manage water efficiently, and monitoring only produces value when staff act on the readings. A broader commercial water conservation and irrigation service program can pair sensor data with audits, repairs, controller changes, and ongoing field review. The strongest ROI case is therefore not “buy probes.” It is “build a repeatable decision system that reduces avoidable watering while protecting the landscape standard.”
Prestonwood Commercial Services can audit commercial irrigation zones, install and calibrate moisture sensors, connect readings to smart controllers, and support ongoing water management across DFW and San Antonio properties. Visit Prestonwood Commercial Landscape Services to discuss a site-specific monitoring plan for your office park, retail center, HOA campus, or institutional grounds.