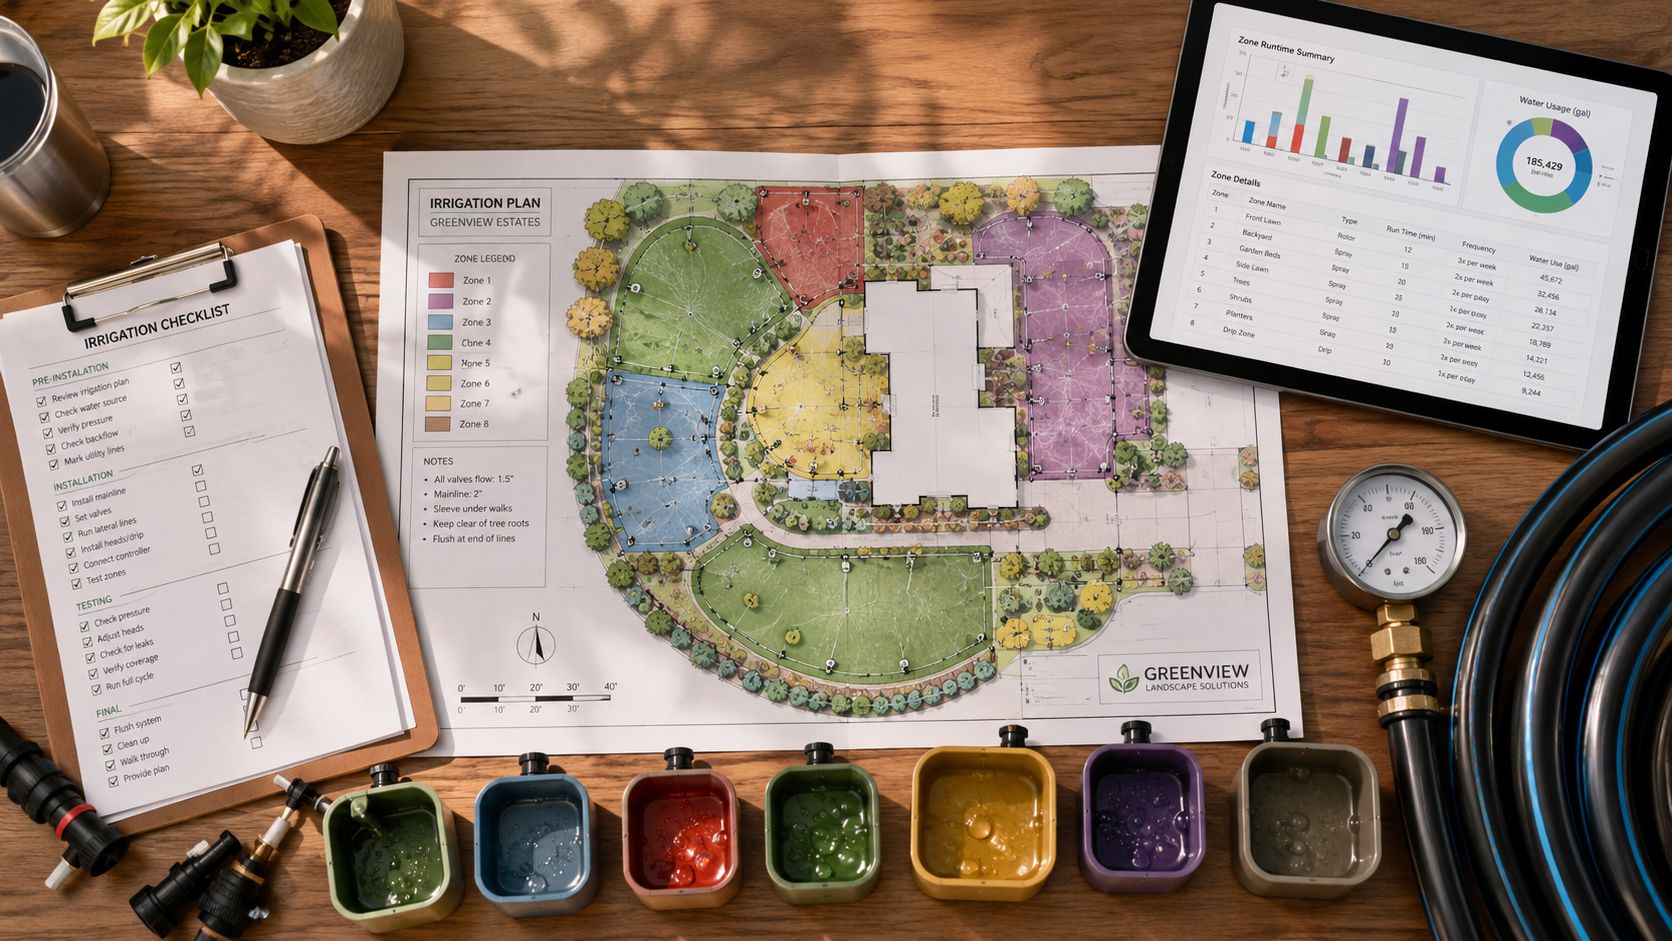
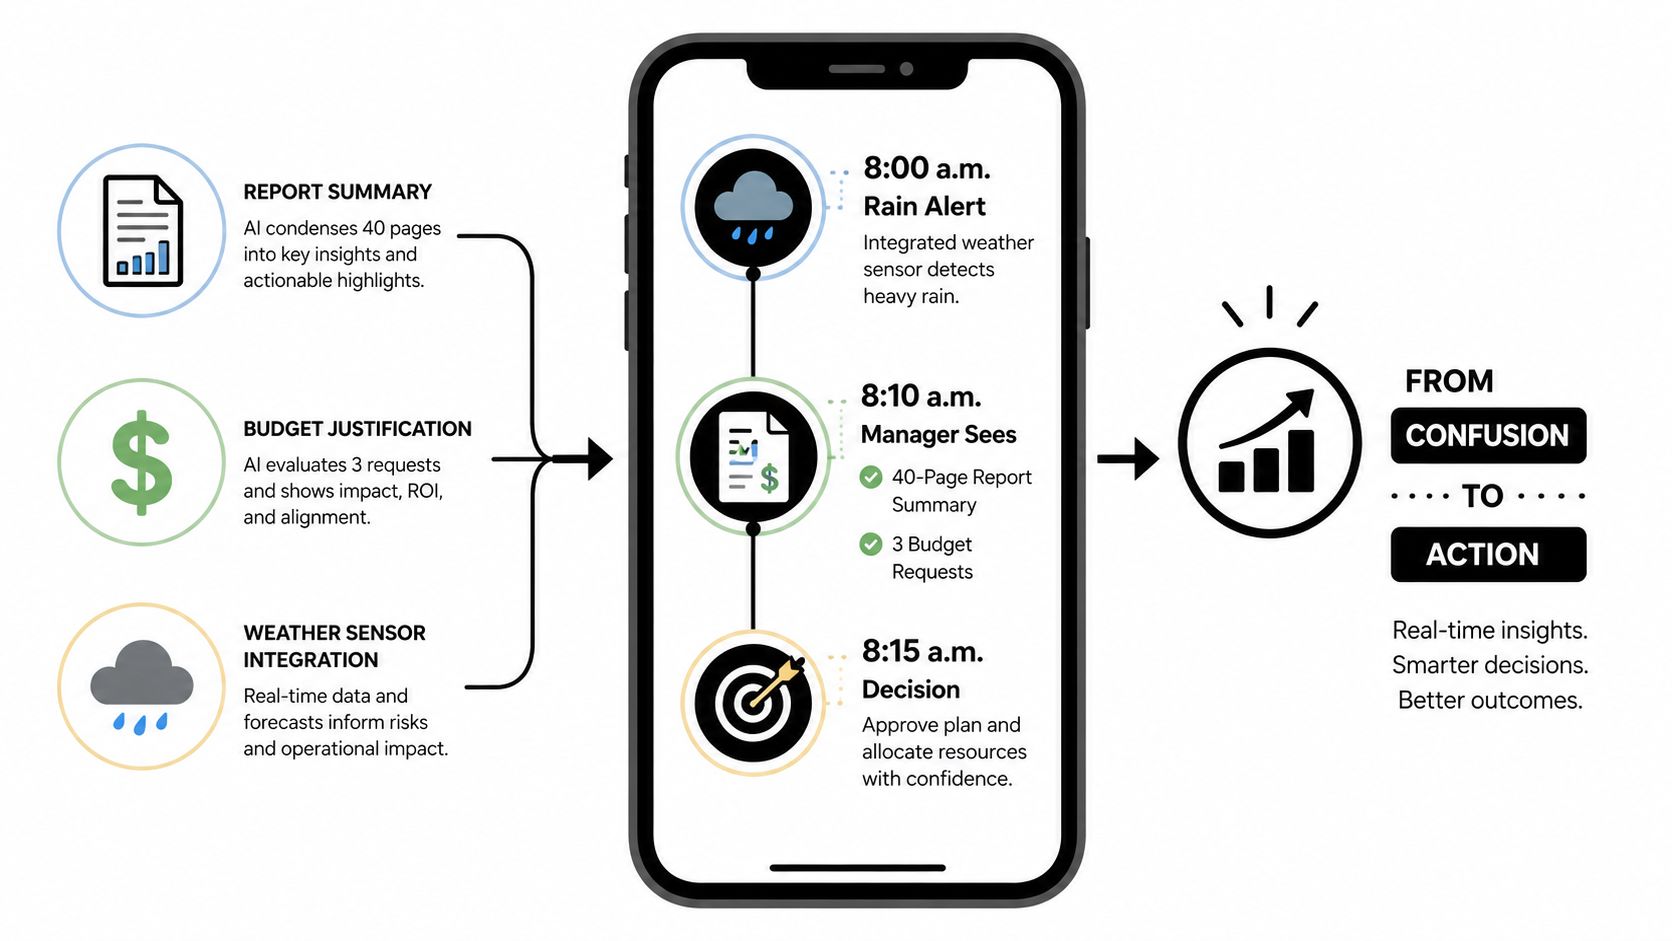
At 8:10 on Monday morning, a property manager opens a forty-page irrigation audit PDF, sees three budget requests, and remembers that one controller ran during last night's rain. The audit is technically complete, but the decisions aren't. Which defect wastes the most water? Should the crew repair sprinkler heads or change the schedule first? Can the request compete with roofing, paving, or HVAC work?
A useful irrigation audit report answers those questions in operating language. It turns field measurements into a ranked action plan, separates scheduling changes from capital repairs, assigns ownership, and defines how the team will verify the result. The report should help you decide what to fix first, what to fund later, and what to test again.
Table of Contents
- What This Guide Solves for Busy Property Managers
- What an Irrigation Audit Report Actually Is
- Anatomy of a High-Quality Audit Report
- Field Data the Auditor Collects
- Reading Distribution Uniformity and Precipitation Rate
- Findings Ranked by Payback and Water Impact
- Why Scheduling Beats Hardware Repairs
- Turning the Report Into a Lifecycle Budget
- Compliance, ESG, and Water Restriction Use Cases
- Verifying Fixes and Proving Savings
What This Guide Solves for Busy Property Managers
Most audit reports are better at documenting problems than prioritizing them. They show photographs of broken heads, tables of pressure readings, and zone-by-zone observations, then leave the property team to decide what matters. That approach creates a familiar failure pattern: urgent-looking hardware gets repaired while poor programming continues to waste water across the entire site.
This guide treats the report as a decision document, not a filing exercise. You'll learn how to judge the quality of the field testing, read distribution uniformity and precipitation-rate results, and connect each finding to water impact, operating risk, cost, and verification.
Use the report as an action register
A credible report should let a manager answer five practical questions without reopening the entire PDF:
- What is wrong? Identify the affected controller, valve, or zone.
- Why does it matter? Explain water waste, plant-health exposure, runoff, compliance risk, or service risk.
- What should happen first? Rank operational changes and repairs by consequence.
- Who owns the action? Name the contractor, irrigation technician, grounds supervisor, or property representative.
- How will completion be proved? Specify the meter review, controller check, catch-can retest, photograph, or invoice required.
The objective isn't to collect more technical detail. It's to make technical detail usable. A report that identifies a problem but doesn't support a funding or scheduling decision is incomplete, even if its measurements are accurate.
What an Irrigation Audit Report Actually Is
An irrigation audit report documents how an installed irrigation system applies water, how evenly it distributes that water, how much it applies, and where performance can improve. The University of Minnesota's water audit handout describes audit procedures that use catch cans to measure precipitation and distribution uniformity, with testing designed to determine whether a zone is overwatering or underwatering and to produce corrective scheduling information.
That makes an audit different from a visual inspection. A walk-through can identify a leaking valve box, tilted spray head, clogged nozzle, or controller that has the wrong program. A performance audit measures what the system delivers under operating conditions. It should connect field observations to pressure, flow, precipitation rate, distribution uniformity, runoff, and runtime.
A strong report also distinguishes measured facts, professional interpretations, and assumptions. For example, a technician might measure low pressure at several heads, interpret the result as a likely coverage problem, and assume that a pressure-regulating repair will improve application uniformity. Those are three different statements and should appear separately.
Three audiences need three kinds of evidence
Operations staff need zone maps, photographs, valve identifiers, and repair instructions. Finance leaders need ranked actions, estimated costs, water consequences, and a clear distinction between capital and operating work. Regulators, sustainability teams, and ownership groups need a traceable baseline, documented methods, and evidence that corrective work was completed.
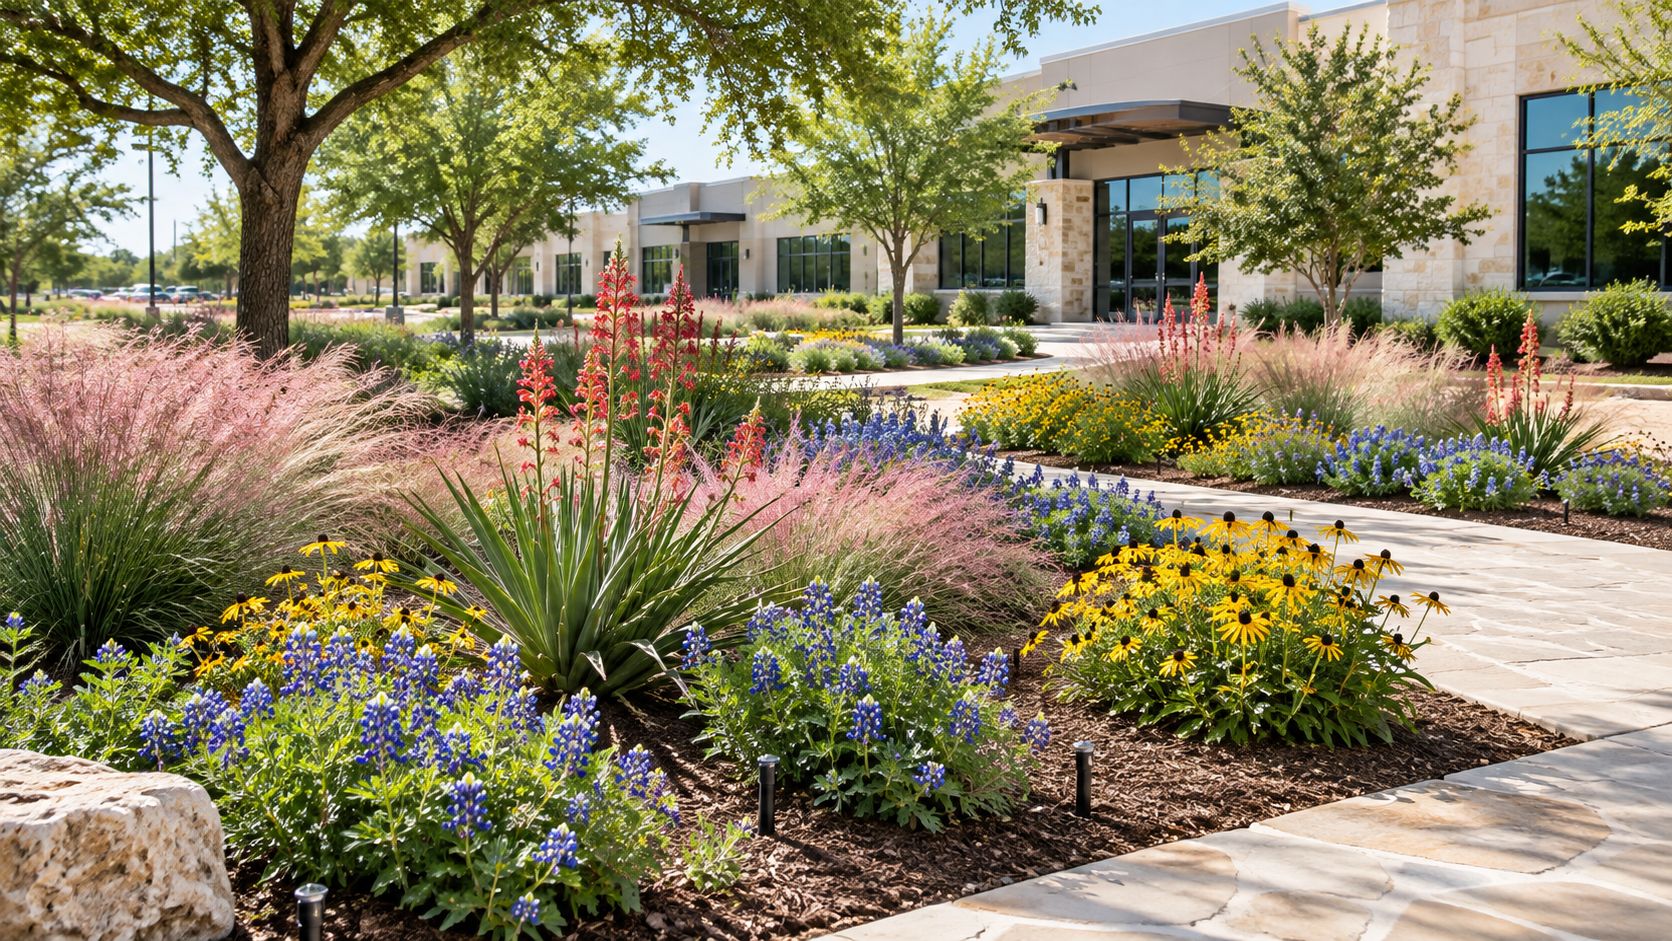
The report's value lies in connecting those needs. Guidance from Prestonwood on water management and irrigation in Texas commercial landscaping is useful context for managers evaluating irrigation as part of broader operations, but the report itself must stand on its own as a site-specific record.
A report isn't complete because it proves that inefficiency exists. It's complete when the property team can identify the intervention, authorize it, implement it, and compare the post-work condition with the original baseline.
Anatomy of a High-Quality Audit Report
Start with an executive summary that ranks actions rather than repeating observations. It should identify the zones with the greatest water, maintenance, or compliance exposure, then state the recommended sequence. Put schedule changes, urgent leaks, pressure problems, nozzle work, and longer-term replacements in separate categories so a reader can see what requires immediate operating attention and what belongs in a capital plan.
Build a traceable site record
The scope should define the property boundary, irrigated areas, plant types, zones tested, audit date, weather conditions, irrigation methods, and excluded areas. If a slope, locked enclosure, safety concern, or access restriction prevented testing, document it. An incomplete scope creates false confidence.
The site inventory should map:
- Controllers and stations: Record controller locations, station assignments, current programs, sensors, and communication equipment.
- Hydraulic components: Identify points of connection, meters, backflow devices, pumps, master valves, filters, pressure regulators, and valve boxes.
- Application equipment: List sprinkler types, nozzle configurations, drip areas, spacing, and representative head locations.
- Site conditions: Note soil texture, slope, sun exposure, plant type, turf condition, drainage, and visible runoff.
Field results should report static and operating pressure, flow where available, catch-can readings, precipitation rate, runtime, and distribution uniformity for each tested zone. The South Australian irrigation performance guidance identifies distribution uniformity as a central efficiency measure and explains how field measurements should lead to management actions such as repairs, tune-ups, and schedule changes.
Make recommendations executable
Every recommendation should contain the defect, affected zone, corrective action, urgency, estimated cost range, expected water benefit, assumption, and verification method. Keep no-cost programming changes separate from capex work. A manager shouldn't need to interpret a technical paragraph to discover that one fix requires a technician today while another can wait for the next budget cycle.
| Report Section | What It Should Contain | Decision Supported |
|---|---|---|
| Executive summary | Ranked findings, risks, actions, and verification plan | What gets approved first |
| Scope and site map | Areas tested, exclusions, dates, and zone locations | Whether the findings are complete |
| Equipment inventory | Controllers, valves, heads, nozzles, sensors, meters, and regulators | Where crews must work |
| Field measurements | Pressure, flow, catch-can readings, runtime, and precipitation rate | What the system actually delivers |
| Performance analysis | Distribution uniformity, runoff, overspray, and calculation methods | Which conditions create waste |
| Recommendations | Action, urgency, cost, benefit, owner, and verification | What should happen next |
| Implementation register | Target date, status, completion evidence, and retest condition | Whether the work is finished |
End with an implementation register. Each accepted action needs an owner, target date, status, physical location, and retest requirement. That register is what turns the audit from a technical archive into a management tool.
Field Data the Auditor Collects
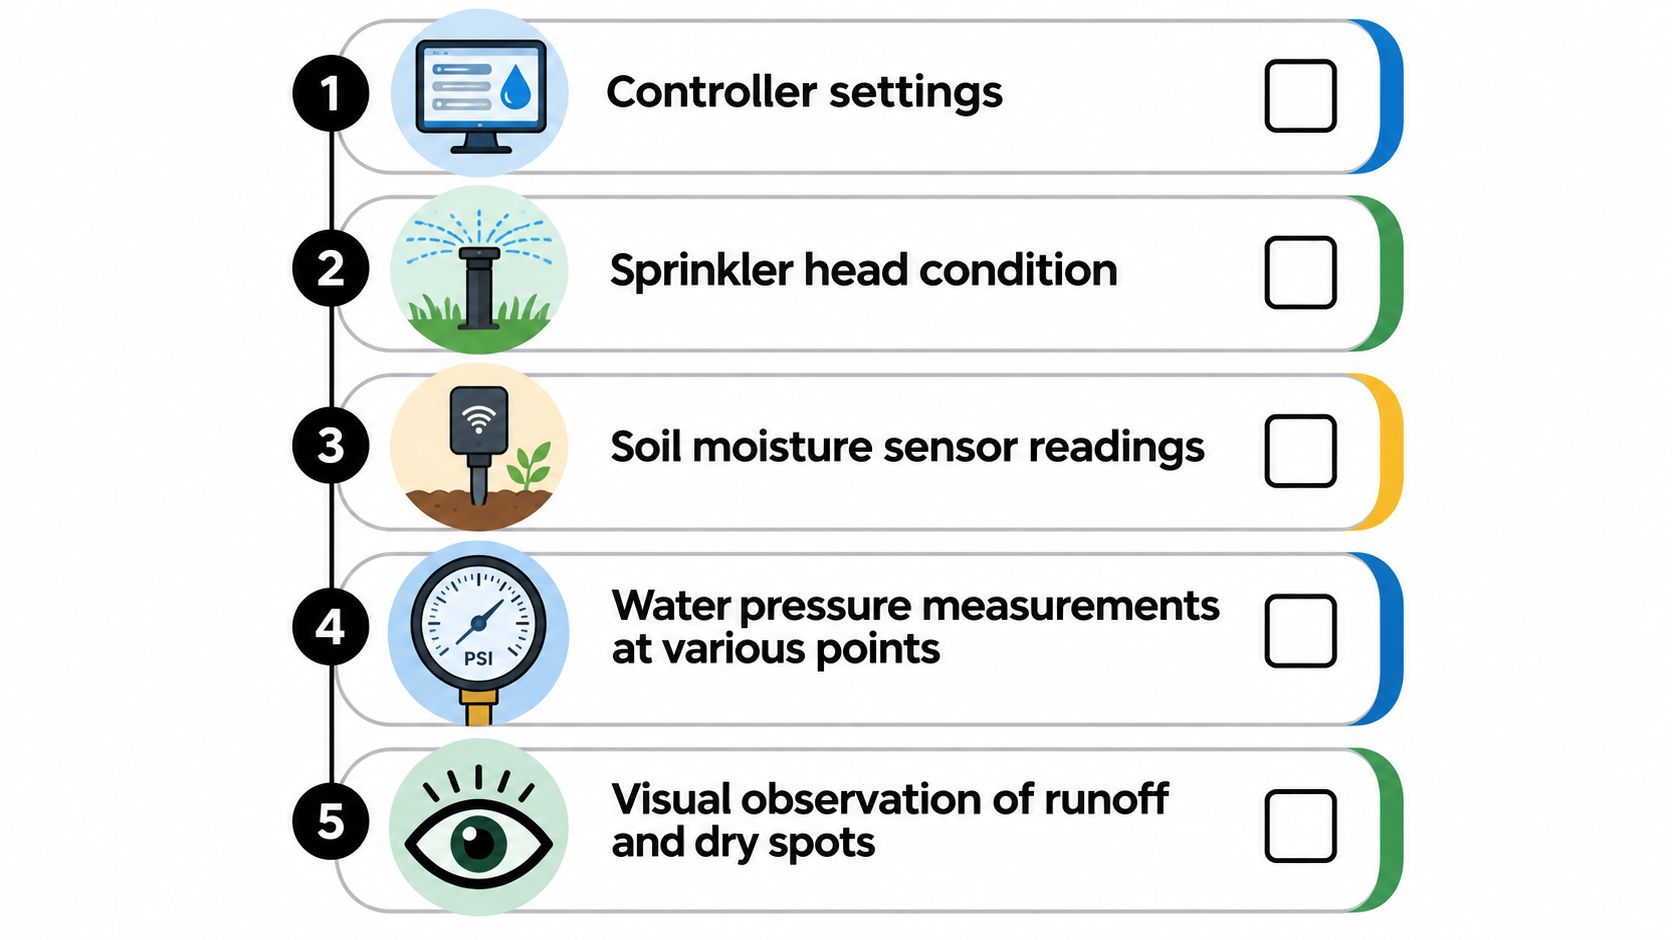
The auditor begins with the controller because programming often explains field conditions that otherwise look like hardware failures. Record the controller brand and model, station count, active programs, seasonal adjustments, start times, run times, rain delays, sensor settings, and any manual overrides. A controller that applies the same runtime to different sprinkler types is already a scheduling concern.
The field walk then tests whether the installed system matches the map and the intended design. The auditor should note sprinkler type and spacing, misaligned heads, clogged or mismatched nozzles, broken risers, damaged valves, leaks, dry areas, saturated areas, overspray, and runoff. Turf stress patterns can reveal poor coverage, but they can also result from soil, shade, compaction, slope, or maintenance practices, so the report should identify competing explanations.
Measure pressure and application
Pressure should be checked at the point of connection and at representative sprinklers under operating conditions. A pressure gauge or pitot-style measurement at the nozzle helps show whether the zone is receiving the pressure needed for the installed equipment. Static pressure alone isn't enough. The system can look adequate when idle and perform poorly when several zones or fixtures draw from the same supply.
Catch-can testing measures actual application across the zone. Standard audit procedures commonly require at least 20 catch cans per zone, with spacing of 5 to 8 feet for small spray systems or 10 to 20 feet for rotor systems, followed by a 20 to 30 minute run time to measure precipitation rate and distribution uniformity, as described in the University of Minnesota audit procedure. Use identical cans in a grid that reflects head spacing, label each location, and record the readings rather than relying on a visual impression.
Flow measurement at the meter, valve isolation, and zone-by-zone operation add hydraulic context. Collect meter readings before and after the test window, then record soil texture, slope, sun exposure, plant material, and drainage. Those inputs explain why a technically correct runtime may still produce runoff or plant stress.
For managers coordinating technicians across multiple properties, it also helps to browse field service features that support work orders, assignments, status updates, and completion records. The platform doesn't replace field measurement, but organized service records make it easier to connect each finding with a responsible person and a documented closeout.
Reading Distribution Uniformity and Precipitation Rate
Distribution uniformity, or DU, tells you how evenly a zone applies water. A common calculation compares the average application in the lowest quarter of catch cans with the overall average. The result is expressed as a percentage. A low result means some areas receive much less water than others, so the operator must run the zone longer to keep the driest locations alive.
The South Australian guidance on irrigation system performance identifies 75% or greater as best practice for DU. Use that benchmark as a management reference, but don't treat it as a substitute for site context. Turf type, nozzle design, spacing, wind, slope, and pressure all affect the appropriate interpretation.
Read DU beside precipitation rate
Precipitation rate, or PR, describes how quickly a zone applies water, commonly in inches per hour. The auditor derives it from catch-can volume, catch area, and test runtime. The number matters because runtime is only meaningful when the manager knows how much water the zone applies during that runtime.
Two zones can run for the same period and apply very different amounts. Mixed nozzle types, mismatched precipitation rates, poor spacing, and pressure variation can skew both total application and uniformity. A good report therefore shows the calculation method and identifies whether the zone uses matched precipitation-rate nozzles.
| Metric | Acceptable | Marginal | Poor |
|---|---|---|---|
| Distribution uniformity | At or above the applicable best-practice benchmark, with site conditions considered | Uneven coverage requiring schedule compensation | Dry spots, excessive compensation, runoff, or rework exposure |
| Precipitation rate | Consistent with equipment, soil intake, and runtime design | Requires cycle-and-soak or schedule adjustment | Produces runoff, overspray, or chronic underapplication |
| Pressure | Suitable for installed heads and nozzles under operation | Variation affects coverage or radius | Severe variation, misting, poor throw, or equipment failure |
| Runtime logic | Based on zone performance and site conditions | Uses broad seasonal assumptions | Fixed or duplicated settings ignore zone differences |
Don't judge DU in isolation. A zone with uneven coverage may need nozzle replacement, head relocation, pressure correction, or a schedule change. The report should state which intervention is most likely to improve the lowest-performing area and how the team will confirm the result.
Findings Ranked by Payback and Water Impact
A report becomes useful when it ranks findings by consequence instead of listing them in discovery order. Start with three questions: how much water does the issue affect, how much does the corrective action cost, and what operational or environmental risk follows if the team delays it?
The ranking should be site-specific. A mainline leak serving a large campus can outrank several minor nozzle defects, even if the nozzles are easier to repair. Conversely, a controller problem affecting every zone can deserve immediate attention because one programming change may influence the whole irrigation operation.
| Finding | Est. Water Savings | Typical Payback | Priority |
|---|---|---|---|
| Controller programming and seasonal scheduling | Quantify from baseline meter and runtime data | Often favorable when the change requires little physical work | Immediate |
| Poorly matched or inefficient nozzles | Quantify by zone after testing | Compare replacement cost with measured water exposure | Immediate to near term |
| Pressure regulation problems | Quantify affected-zone application loss | Depends on regulator, valve, or hydraulic repair | High |
| Broken heads and visible leaks | Quantify flow or affected runtime | Usually depends on repair scope and access | High where runoff or plant loss is visible |
| Drip conversion in suitable bed zones | Quantify after design review | Longer-term capital decision | Planned |
| Mainline leaks, master valve failures, or pump inefficiency | Quantify from flow and meter evidence | May require substantial investigation or capital | High risk, site-dependent |
The audit should not invent savings where the baseline is weak. Use measured flow, meter history, runtime, and tested application rates. A documented study of 117 high water-using residences found an average 19% reduction in total potable water use, equal to 84,600 gallons saved per residence per year, after irrigation audits. The researchers concluded with 99% certainty that audits caused at least a 13.4% reduction for homes previously using more than 300 gallons per capita per day, and estimated a countywide program could conserve 622,000 gallons per day. Those results are from residential high-use properties, so commercial managers should use them as evidence that audits can drive measurable change, not as a promise for a specific site. See the published water-use analysis.
Use a staged action queue
For a twenty-zone commercial site, the first ninety days should contain urgent leaks, controller corrections, unsafe runoff conditions, and repairs that protect plant health or equipment. The one-year queue can include nozzle standardization, pressure work, sensor integration, and zones that need additional design attention. The three-year queue can hold larger conversions, aging infrastructure, and capital replacements that require planned funding.
For a practical framework on conserving water through irrigation operations, managers can review commercial water-conservation irrigation guidance. The report still needs to translate that principle into zone-specific actions, owners, dates, and verification requirements.
Why Scheduling Beats Hardware Repairs
Poor scheduling is frequently the largest controllable source of waste because it affects every irrigation event. A broken head affects a location. A controller that runs too long, runs at the wrong time, or applies one runtime across incompatible zones can affect the entire operating program.
Three patterns deserve immediate scrutiny:
- Fixed runtimes year-round: The controller applies the same duration through changing weather and plant demand.
- Peak-hour starts: The program runs when evaporation, wind, or site activity makes application less effective.
- Identical cycles across different equipment: Rotors, sprays, drip zones, slopes, and clay soils receive the same treatment despite different application and intake rates.
The audit should connect each pattern to measured evidence. Review controller history, meter data, precipitation rate, runoff observations, and plant condition. Don't label a schedule inefficient merely because it looks old. Show which runtime, start time, or zone grouping creates the exposure.
Rebuild the schedule around the site
A competent schedule separates hydrozones, accounts for precipitation rate, and uses cycle-and-soak intervals where soil intake or slope makes one long application unsafe. Weather-based control and soil-moisture sensing can improve decision quality when the sensors are installed, calibrated, and maintained properly. A smart controller won't correct poor hydraulic design, but it can prevent a known schedule from running unchanged.
Practical rule: Change the schedule first when the audit shows system-wide overwatering, then retest the zones that still display uneven coverage or runoff.
The Irrigation Association's audit guidance frames audits as evaluations of both system performance and management, and cites audit-oriented pathways associated with 25% to 30% water-use reduction. That supports a clear operational position: don't spend capital on hardware before correcting controllable programming problems and measuring the remaining gap.
For teams managing several properties, landscape scheduling software can help organize recurring work and controller-related tasks. Software won't replace a properly tested schedule, but it can make seasonal review, accountability, and closeout less dependent on memory.
| Action | Typical Capital Cost | Annual Water Savings | Payback Period |
|---|---|---|---|
| Controller reprogramming | Low or no physical capital | Establish from baseline and meter data | Calculate from service cost and verified savings |
| Seasonal schedule refinement | Low operating cost | Establish from seasonal runtime and consumption records | Often an early operational candidate |
| Cycle-and-soak redesign | Low to moderate service effort | Establish from runoff reduction and meter data | Site-dependent |
| Nozzle or head replacement | Physical repair capital | Establish by zone testing | Compare measured benefit with installed cost |
| Controller, sensor, or flow-monitor upgrade | Planned capital | Establish after commissioning and baseline comparison | Include maintenance and verification |
Turning the Report Into a Lifecycle Budget
Treat every audit finding as one of three budget items. Capex covers physical improvements such as nozzle replacement, valve rebuilding, pipe work, or a controller upgrade. Opex covers programming, seasonal adjustments, inspections, service labor, water consumption, and recurring maintenance. Verification covers the testing and records needed to confirm that the work delivered its intended result.
This structure prevents a common budgeting mistake. Managers often request money for repairs but omit the cost of commissioning, retesting, documentation, and future maintenance. A project isn't financially complete when the parts are installed. It's complete when the system operates as intended and the property can show the result.
Assign each finding to a planning horizon
Use the report's ranking to place actions into immediate work, the next budget cycle, or a longer reserve plan. Keep the logic visible:
- Immediate: Address leaks, runoff hazards, controller errors, and failures that threaten plant health or compliance.
- Near term: Fund nozzle standardization, pressure correction, sensor work, and recurring zone improvements.
- Longer term: Plan infrastructure replacement, drip conversion, pump work, or full controller modernization where the capital case is sound.
Track expected lifecycle cost by zone over the chosen planning horizon. Include purchase, installation, programming, maintenance, verification, and likely replacement exposure. A cumulative savings curve should show when projected water savings offset the project cost, but it must remain labeled as a projection until meter and retest data confirm it.
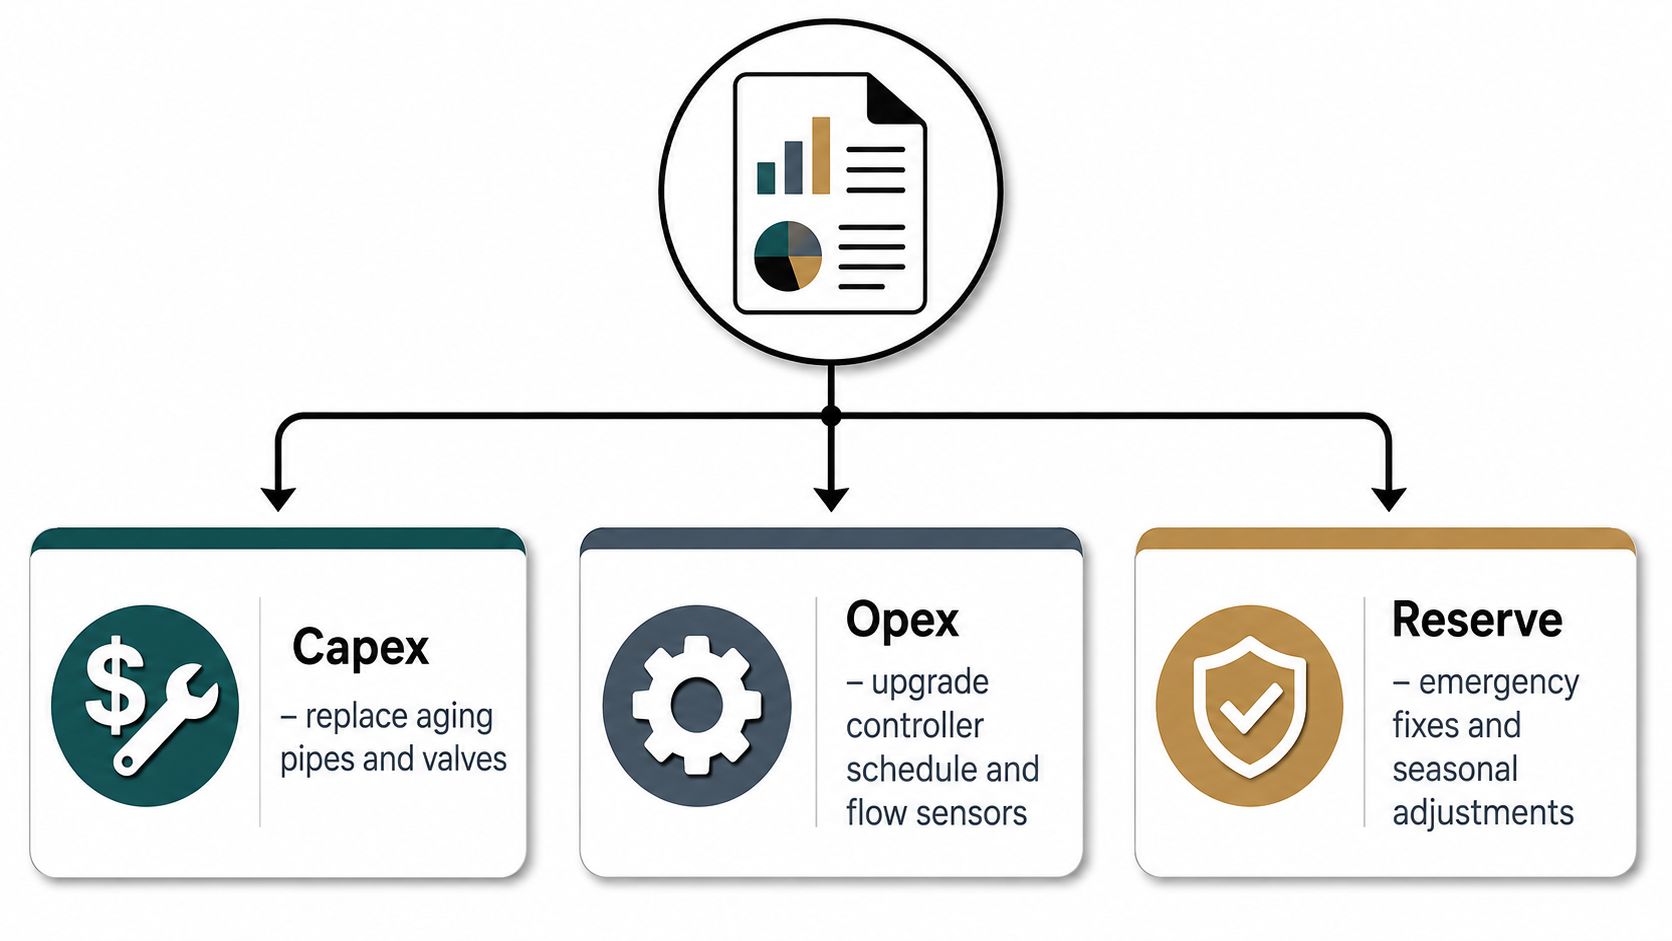
A useful budget request contains the baseline, proposed work, assumptions, expected operational benefit, verification method, and consequence of delay. That format lets ownership compare irrigation work with paving, roofing, and HVAC using the same decision language.
Compliance, ESG, and Water Restriction Use Cases
A dated irrigation audit report gives a commercial property a defensible record when water use becomes a compliance or reporting issue. During municipal restrictions, the report can show that the team measured system performance, identified corrective actions, and established appropriate operating settings. It may support a variance or hardship discussion where local rules allow one, but the report can't replace the applicable ordinance or agency process.
Sustainability teams need a reliable baseline rather than a general statement that the property uses efficient irrigation. The report can provide the site map, zone results, precipitation rates, distribution uniformity values, recommended runtime table, meter context, and corrective-action log needed to explain how water is managed.
The California MWELO irrigation audit checklist illustrates the compliance-grade direction of audit documentation. It calls for measurable performance information and, in some municipal standards, work by a certified irrigation auditor who may be restricted from auditing a system they originally designed or installed.
Build evidence that survives review
A regulator, owner, or ESG reviewer should be able to identify:
- Baseline conditions: Audit date, weather, meter context, equipment status, and tested zones.
- Methodology: Catch-can arrangement, runtime, pressure method, calculations, and exclusions.
- Corrective actions: Finding, responsible party, target date, completion status, and supporting evidence.
- Outcome: Retest data, updated programming, meter comparison, and unresolved exceptions.
The California Department of Water Resources audit checklist emphasizes field data, performance analysis, and recommendations. That standard is a useful discipline even when a property isn't submitting the report to an agency.
Verifying Fixes and Proving Savings
Close every accepted finding with evidence. Repeat the catch-can test 30 days after repairs, compare distribution uniformity and precipitation rate with the baseline, and record before-and-after meter readings across a full billing cycle. The retest should use comparable operating conditions and identify any excluded zones.
Request as-built drawings, controller programming sheets, itemized completion invoices, updated zone maps, and photographs tied to each finding. Then create a one-page reconciliation showing projected gallons and cost benefits beside actual consumption, with assumptions clearly marked.
If a zone misses its target, don't declare the audit a failure. Escalate it for a focused review of pressure, nozzle match, valve operation, runoff, and programming. A post-audit report is credible when it shows what changed, what didn't, and what the property team will do next.
Prestonwood Commercial Landscape Services can help commercial property teams assess controllers, valves, heads, pressure, spray overlap, runoff, and seasonal irrigation performance, then turn findings into repair and scheduling priorities. Visit Prestonwood Commercial Landscape Services to discuss an irrigation audit report that supports day-to-day operations, capital planning, and documented verification.