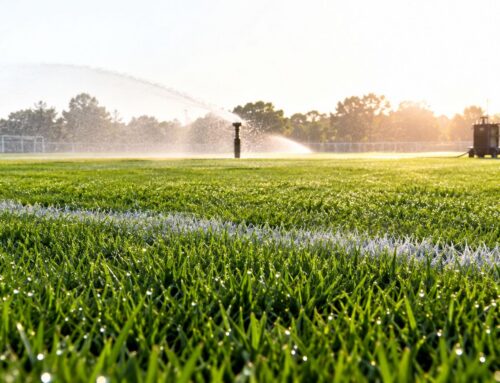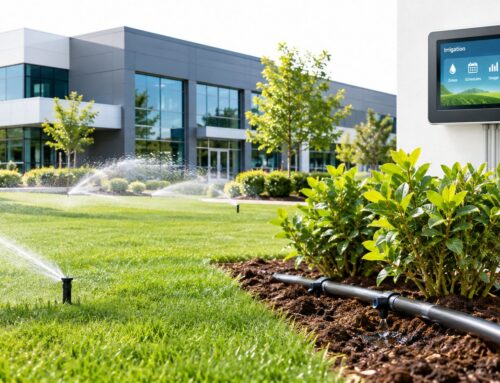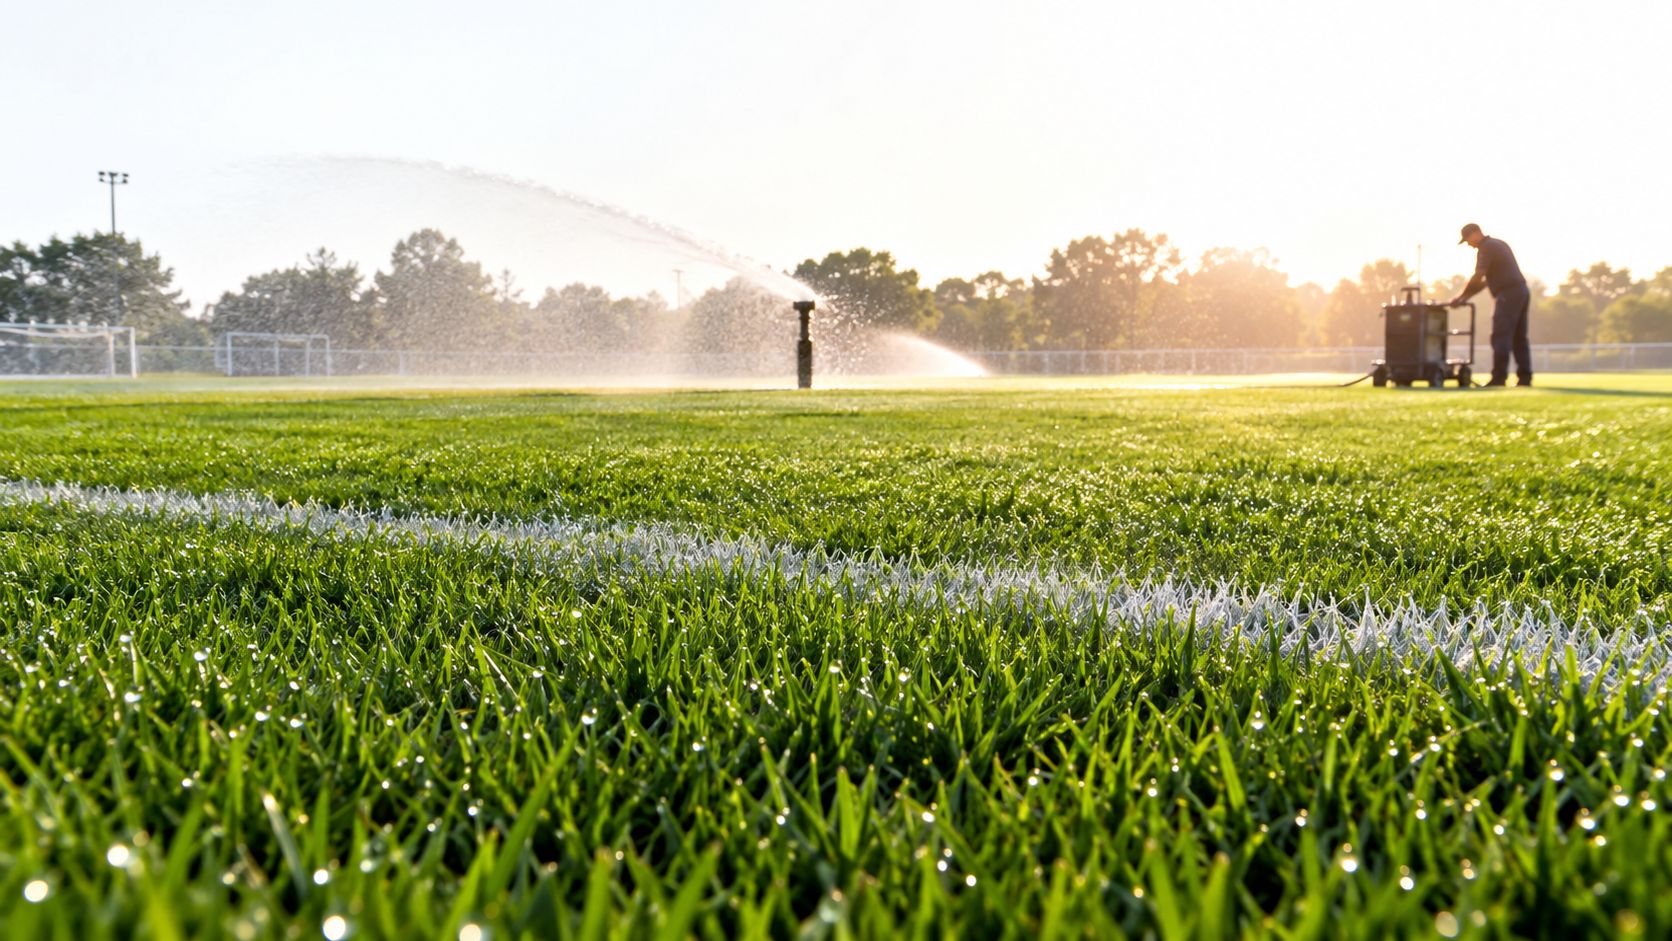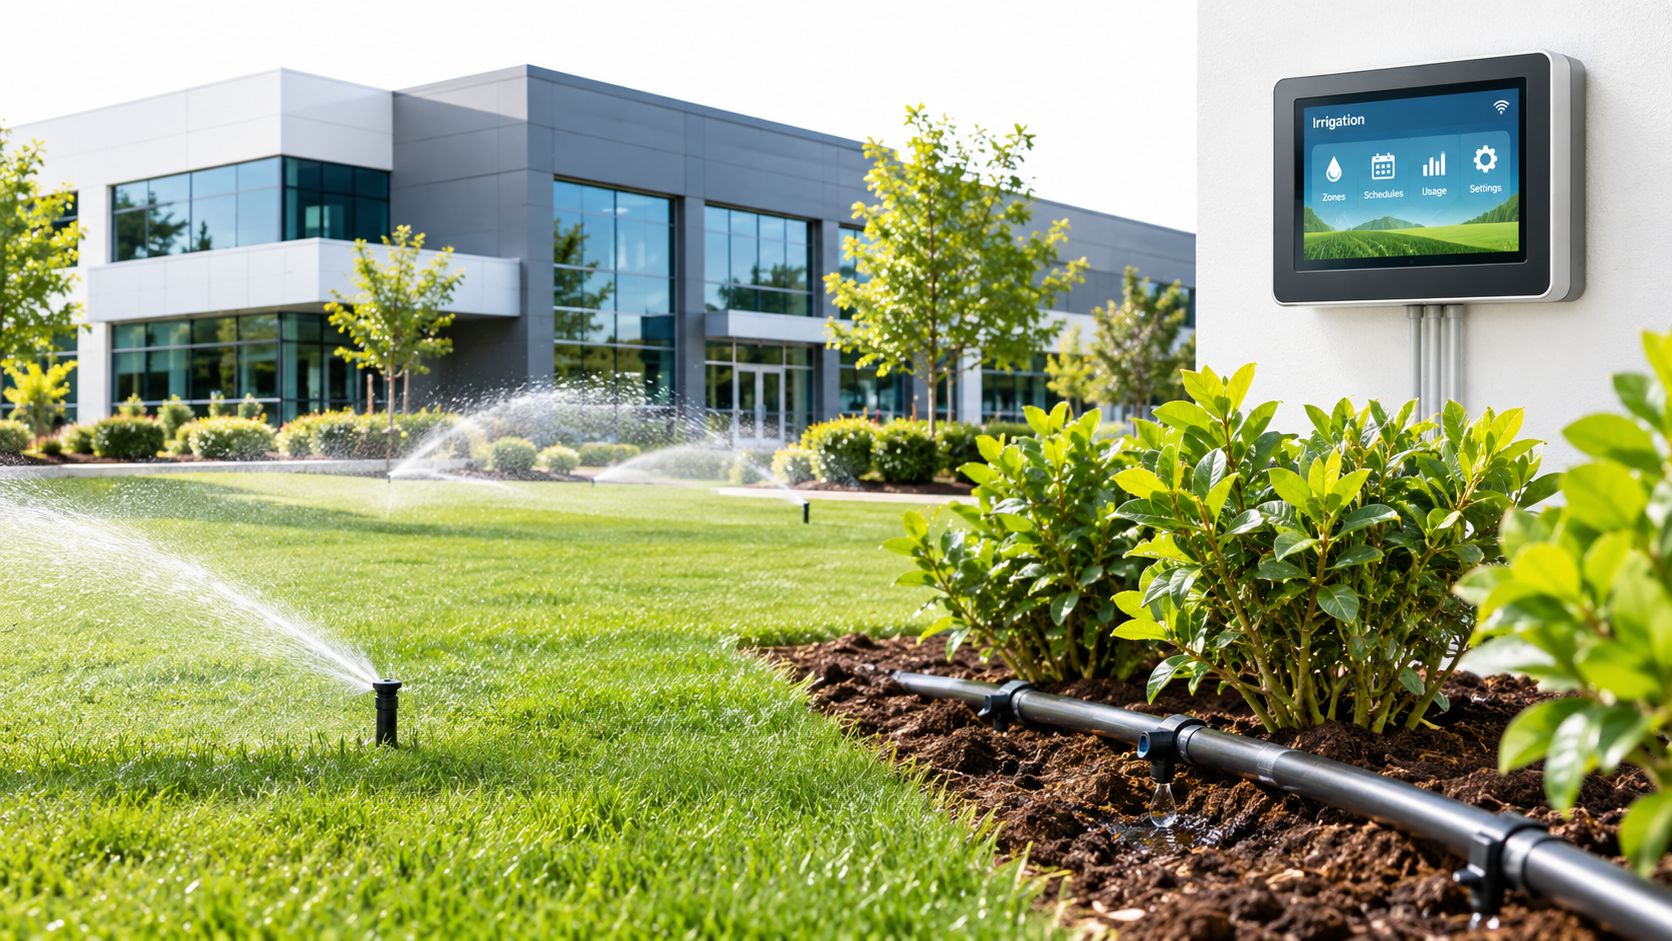

You're reviewing a maintenance invoice, walking a property where the turf looks acceptable, and still can't answer the question your asset manager will ask next: is the landscape performing, or are we paying to keep it presentable? A green lawn this week doesn't reveal whether irrigation is uniform, whether plant replacements are accelerating, or whether maintenance costs are rising.
That information gap is exactly what performance metrics should solve. The answer isn't another thick vendor report. It's a focused operating dashboard that connects site conditions to decisions about irrigation, labor, safety, compliance, appearance, and capital planning.
Table of Contents
- Why Most Property Managers Cannot Tell If Their Landscape Is Working
- How Landscape Performance Became a Measurable Discipline
- The Core Categories Every Commercial KPI Falls Into
- Water Metrics That Go Beyond Total Gallons Saved
- Benchmarks That Separate a Performing Site From a Failing One
- Collecting and Reporting Data Without Drowning in Spreadsheets
- Turning Metrics Into Better Landscape Management Decisions
Why Most Property Managers Cannot Tell If Their Landscape Is Working
A property manager often receives plenty of activity data. The contractor reports mowing visits, labor hours, irrigation repairs, seasonal color installations, and completed work orders. Those details describe what crews did, but they don't prove whether the property is achieving its intended results.
The distinction matters. Inputs are not outcomes. A site can receive every scheduled mowing visit and still have declining turf, compacted soil, poor drainage, or irrigation zones that distribute water unevenly. A contractor can report estimated water use while stressed planting beds reveal that the schedule doesn't match actual site demand.
The feedback loop is usually backward
Most commercial properties react to visible complaints. A tenant reports a dead shrub, a manager notices standing water, or an owner questions a replacement charge. By then, the operating issue has already become a repair, a service failure, or a capital request.
Use metrics to move the conversation earlier:
- Water performance: Compare applied irrigation with site demand and the approved water budget.
- Plant condition: Record whether trees, shrubs, turf, and seasonal beds are holding their intended condition.
- Maintenance productivity: Track whether labor is addressing priority work or repeating avoidable tasks.
- Risk and compliance: Document hazards, access issues, irrigation restrictions, and code-related conditions.
- Lifecycle cost: Separate routine care from replacement patterns that indicate a design or management problem.
The Landscape Architecture Foundation describes performance as a measure of how efficiently solutions achieve intended outcomes. Its research framework includes more than 100 metrics across 33 benefit categories, spanning environmental, social, and economic results, as documented in the Landscape Performance Series evaluation guide. That breadth is useful for research, but a property manager needs a smaller operating set.
Practical rule: If a metric doesn't change a maintenance action, a budget decision, a contract requirement, or a risk response, it probably doesn't belong on the weekly dashboard.
Start with a baseline inspection, assign ownership for each measurement, and define the response when a score falls below target. The point isn't to make landscaping more academic. It's to replace subjective reassurance with evidence that helps you protect the asset before the next season exposes the weakness.
How Landscape Performance Became a Measurable Discipline
Commercial management grew out of an aesthetic model. A supervisor judged the grounds by appearance, and an owner judged the supervisor by whether the property looked acceptable during a site visit. That model still has value, because curb appeal matters, but it can't explain water demand, habitat, maintenance burden, user experience, or long-term replacement needs.
The modern discipline formalized a broader question: what does the environment accomplish, and how efficiently does it accomplish it? The Landscape Architecture Foundation's Landscape Performance Series helped establish a practical structure for documenting environmental, social, and economic outcomes. Its research catalog now organizes performance around a wide range of measurable benefits rather than treating appearance as the only result that matters. The Landscape Architecture Foundation research library reflects that multidimensional approach.
Why the history matters to operations
This shift gave commercial managers a defensible reason to ask for more than completed tasks. The outdoor environment can provide shade, manage stormwater, support habitat, reduce maintenance intensity, conserve water, and improve the experience of people using the property. Those outcomes can be connected to inspections, audits, cost records, and occupant feedback.
Today's tools extend that logic. Smart controllers, flow meters, moisture sensors, weather data, GIS inventories, and mobile inspection forms make it easier to compare actual conditions with design intent. The technology hasn't changed the fundamental operating principle. Measure the result, identify the gap, and assign a corrective action.
The historical framework also helps managers challenge vague sustainability language. “Water efficient” should lead to questions about water budgets, distribution uniformity, leaks, and scheduling. “Low maintenance” should lead to labor and replacement records. “High quality” should lead to a defined condition score and documented inspection method.
Performance metrics are therefore not a passing reporting trend. They're the operational extension of a discipline that moved evaluation from broad description toward quantified benchmarking. Your dashboard can be simpler than an academic study, but it should follow the same discipline, clear intent, measurable outcomes, consistent collection, and documented decisions.
The Core Categories Every Commercial KPI Falls Into
A commercial dashboard needs coverage across the site's operating obligations. Water alone won't tell you whether the property looks professional, remains safe, or is becoming expensive to maintain. The most useful framework includes eight KPI families, each answering a different management question.
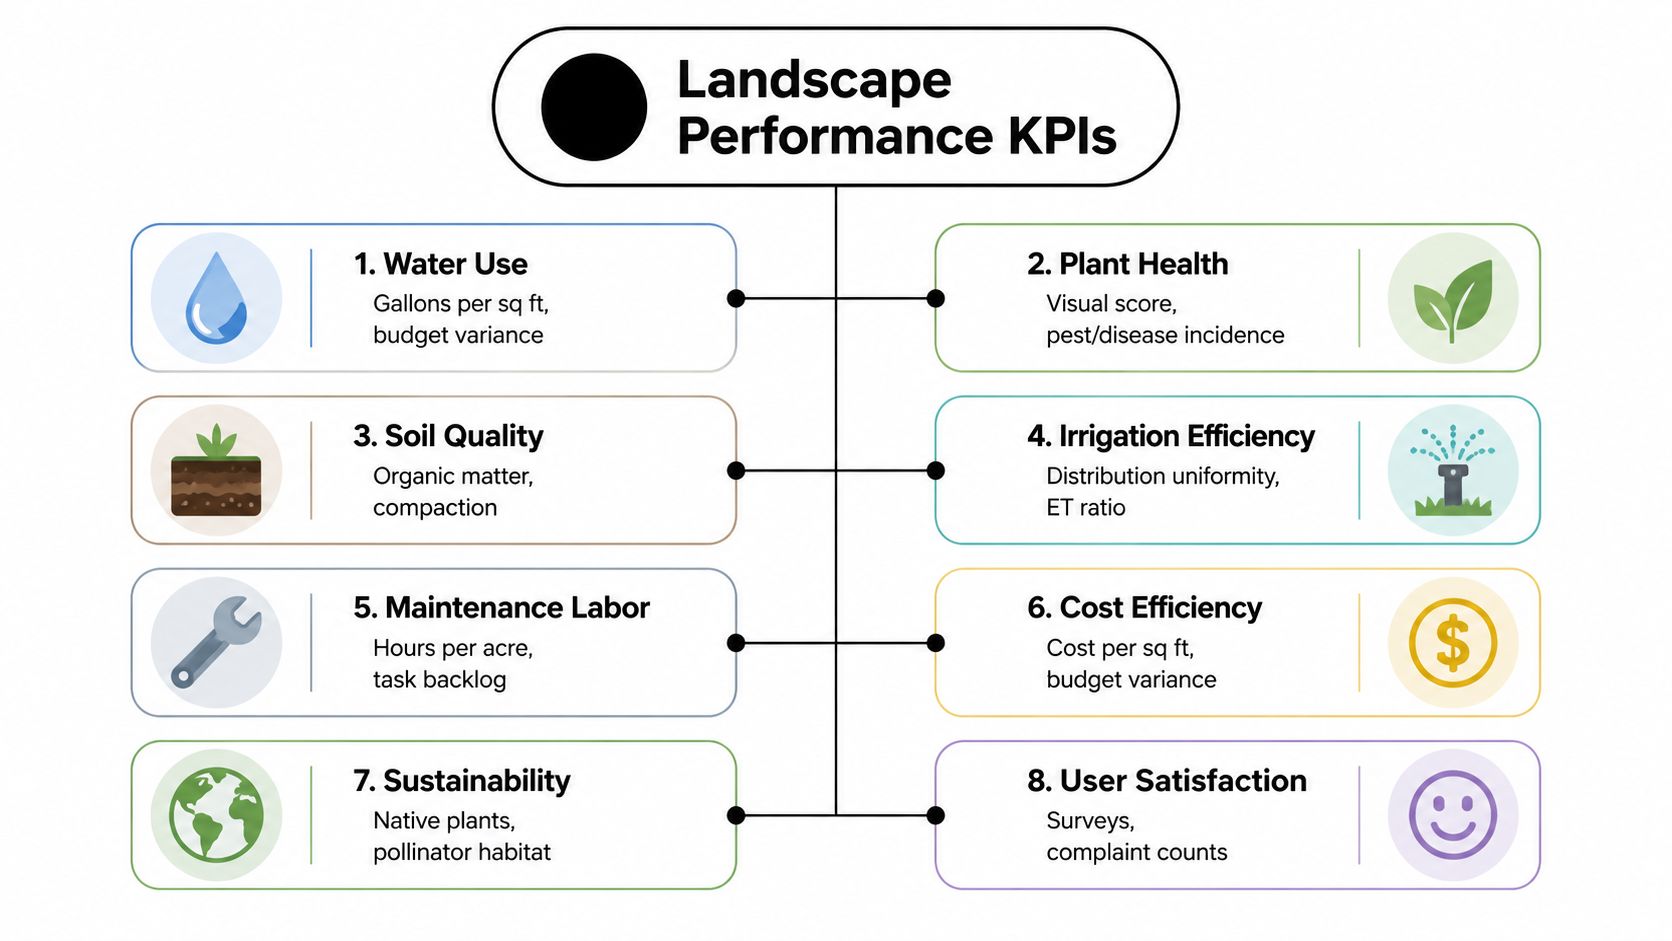
Water use
Track irrigation volume, water budget variance, and demand by hydrozone where the data is available. This answers: are we applying more water than the site requires? Water deserves priority because the EPA reports that irrigation represents nearly one-third of residential water use nationwide, totaling nearly 9 billion gallons per day, and that inefficient systems can lose as much as 50% of outdoor water through wind, evaporation, and runoff, as described in its outdoor water efficiency guidance.
Plant health
Record condition by plant group, including turf, trees, shrubs, and seasonal beds. This answers: is the biological investment holding its intended condition? Include pest and disease observations, stress symptoms, replacement frequency, and survival of new installations.
Aesthetic condition
Use a repeatable appearance score tied to the property's brand standard and seasonal expectations. This answers: does the site look acceptable for tenants, visitors, and ownership? A score is useful only when inspectors apply the same criteria and document exceptions with location-based notes or photographs.
Maintenance efficiency
Measure labor hours against maintained area, route density, task backlog, and rework. This answers: is the crew spending time on productive care, or compensating for preventable problems? A high labor burden may indicate poor plant selection, inefficient routing, recurring irrigation failures, or unclear scope.
Lifecycle cost
Combine routine operating expense with replacement and renovation patterns. This answers: what does the property really cost to own over time? A low maintenance invoice can be misleading if the property repeatedly replaces failed plants or defers irrigation infrastructure.
Compliance
Track water restrictions, required documentation, accessibility conditions, and municipal requirements. This answers: are we operating within the rules that protect the property from avoidable exposure? Compliance belongs in the same dashboard as appearance because a visually attractive site can still create an operational problem.
Safety
Inspect trees, hardscape, trip hazards, lighting interfaces, drainage, and areas with repeated public use. This answers: could a condition create injury, damage, or liability? Safety findings need priority levels, responsible parties, and closure dates, not just a pass or fail.
Customer satisfaction
Use tenant, visitor, or facility feedback to test whether the grounds support the user experience. This answers: do occupants see the property as cared for and functional? Complaint counts, survey responses, and recurring service requests are more useful when tied to location and issue type.
For managers building a reporting stack, the Oviond reporting methodology offers useful context on defining sources, organizing measurements, and turning raw data into a report people can act on. The dashboard should stay concise, but its definitions must remain precise.
Water Metrics That Go Beyond Total Gallons Saved
“Gallons saved” is an incomplete performance measure. A property can reduce total use while leaving one zone saturated, another zone dry, and a third zone leaking below the surface. The better approach evaluates how evenly and appropriately water reaches the area.
Start with distribution uniformity
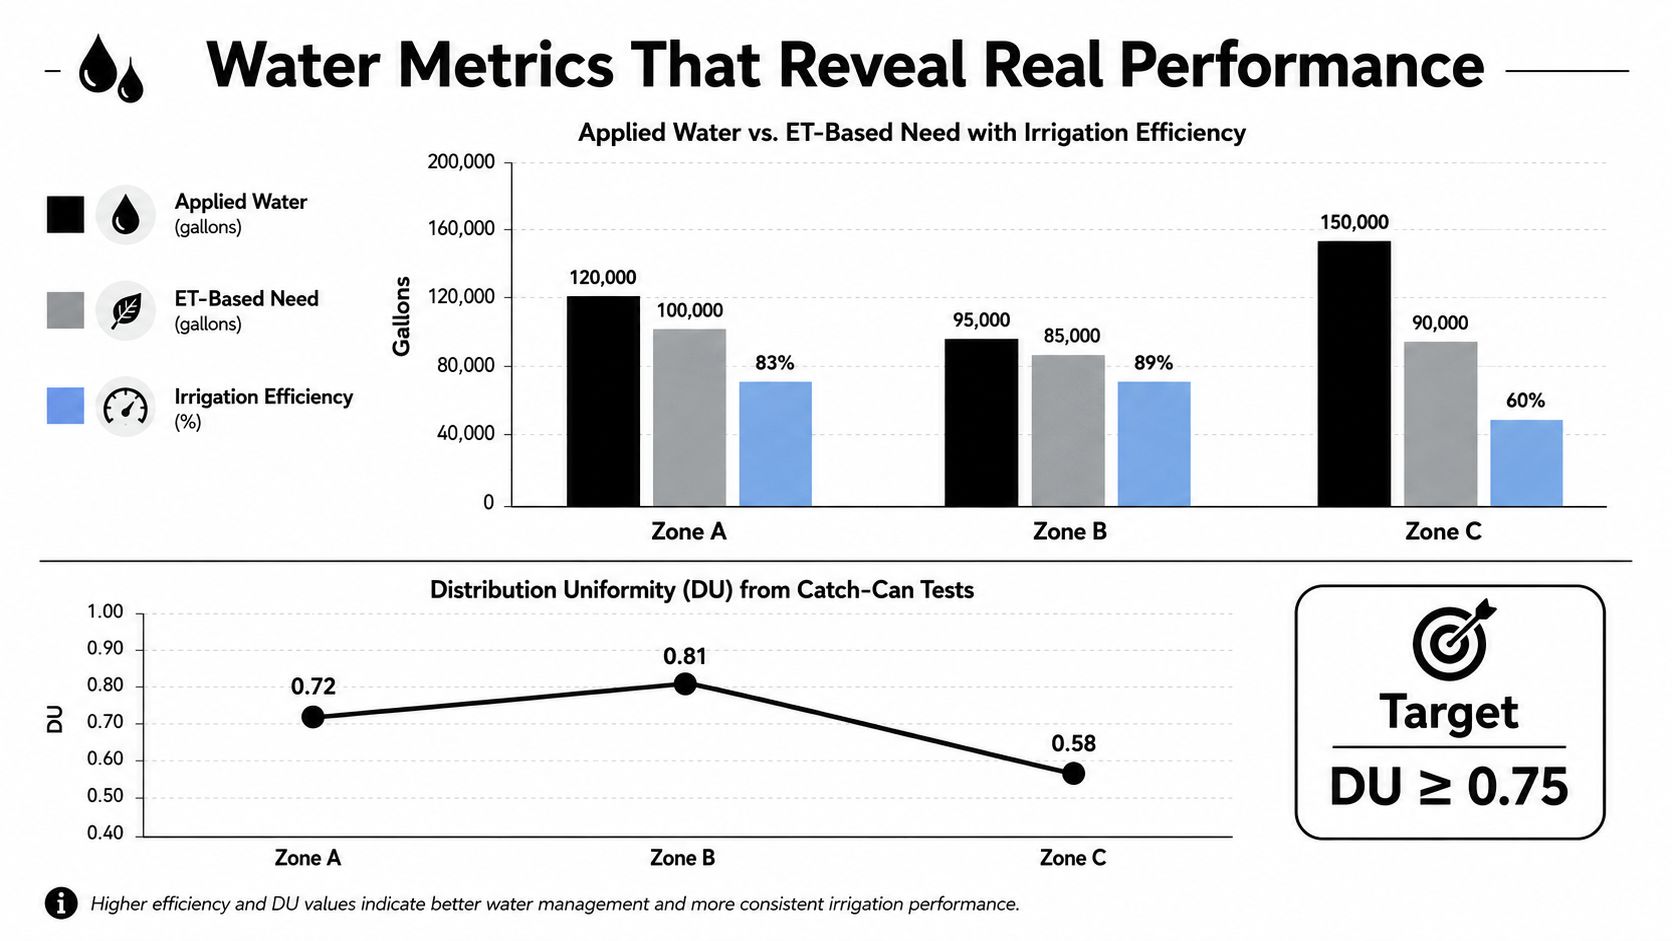
Distribution Uniformity, or DU, compares water received by the driest portion of an irrigation zone with the zone's average application. Irrigation Association guidance explains that a DU of 0.75 means the driest quarter receives 75% of the average application, and professional practice commonly treats about 0.75 as a practical minimum. High-quality drip systems can exceed 0.90, according to the same landscape irrigation water management guidance.
A field audit uses catch cans distributed across a representative zone. The auditor runs the system, measures collected water, identifies the low-quarter results, and calculates DU. The auditor should also record pressure at the point of connection and inspect heads, nozzles, leaks, overspray, clogged emitters, and broken laterals.
Compare applied water with demand
An efficiency ratio compares applied water with evapotranspiration-based demand, or ET-based need. If the controller applies substantially more water than the site requires, investigate scheduling, pressure, nozzle selection, soil infiltration, and sensor inputs before cutting runtime.
Water budget compliance adds the monthly management layer. Compare actual use with a site-specific budget informed by area, plant material, weather, and reference evapotranspiration. A property can meet its total budget while individual zones remain poorly adjusted, so review both the property total and zone-level exceptions.
EPA WaterSense guidance reports that replacing a clock-based controller with a WaterSense-labeled controller can reduce an average home's irrigation use by up to 30% and save up to 15,000 gallons annually, while regular maintenance by certified irrigation professionals can reduce use by 15%, or nearly 9,000 gallons per household per year. EPA's WaterSense at Work guidance also says efficiency improvements can reduce outdoor water use by more than 50%, establishing a useful conservation benchmark. Those figures come from the linked EPA guidance, but commercial managers should still verify results through meters, audits, and plant condition.
For operational context, review what smart water management involves before specifying smart controllers or sensors. Premium equipment earns its place only when the team reviews DU, efficiency, leaks, and budget compliance at zone resolution.
Benchmarks That Separate a Performing Site From a Failing One
Benchmarks make a dashboard useful because they convert observations into decisions. They also need consistent methods. A DU result from a proper catch-can audit isn't comparable with a visual guess, and a plant score from one inspector may not match another inspector's score without a written rubric.
Use the table below as an operating starting point. The DU ranges and efficiency thresholds are grounded in the irrigation guidance cited earlier. The other categories should be calibrated to the property's design intent, seasonal expectations, contract scope, and historical records.
Performance Benchmarks by KPI Category
| KPI Category | Performing | Average | Underperforming |
|---|---|---|---|
| Distribution uniformity | Above 0.65, with zone-level exceptions investigated | Between 0.50 and 0.65, recurring adjustment needed | Below 0.50, corrective irrigation work required |
| Plant health | Index of 4 or higher on a 5-point scale | Index of 3, visible stress or recurring replacement | Index of 2 or lower, widespread decline |
| Aesthetic condition | Meets seasonal brand standard with minor exceptions | Acceptable from a distance, inconsistent in detail | Fails visible standards or generates recurring complaints |
| Maintenance labor efficiency | About 0.3 to 0.5 acres per crew hour | Productivity varies by route or task mix | Persistent backlog, rework, or inefficient routing |
| Lifecycle replacement cost | Under 4% of total landscape operating expense annually | Replacement patterns fluctuate without a clear cause | Repeated failures consume capital and operating budgets |
| Water budget compliance | Actual use tracks the approved site budget | Variance requires investigation and correction | Persistent variance or unreliable measurement |
| Safety and compliance | Findings are documented and closed on schedule | Minor open items remain | Unresolved hazards, access issues, or code exposure |
| Customer satisfaction | Few recurring complaints and positive site feedback | Mixed feedback concentrated in certain areas | Repeated complaints tied to visible or functional failures |
A property-wide average can hide a failing corner. One broken rotor line, stressed bed, or hazardous tree may disappear inside a portfolio-level score. Review every metric by zone, bed, route, or site area whenever the decision depends on local conditions.
Managers responsible for retail properties can also compare this approach with broader essential retail KPI tracking, especially where customer experience and operational consistency affect multiple locations. For commercial work, the same principle applies: define the expected condition, measure it consistently, and attach a response to the exception.
Use commercial property maintenance planning to connect those thresholds with recurring service scopes, inspection responsibilities, and budget reviews. A benchmark without an assigned action is just a number on a report.
Collecting and Reporting Data Without Drowning in Spreadsheets
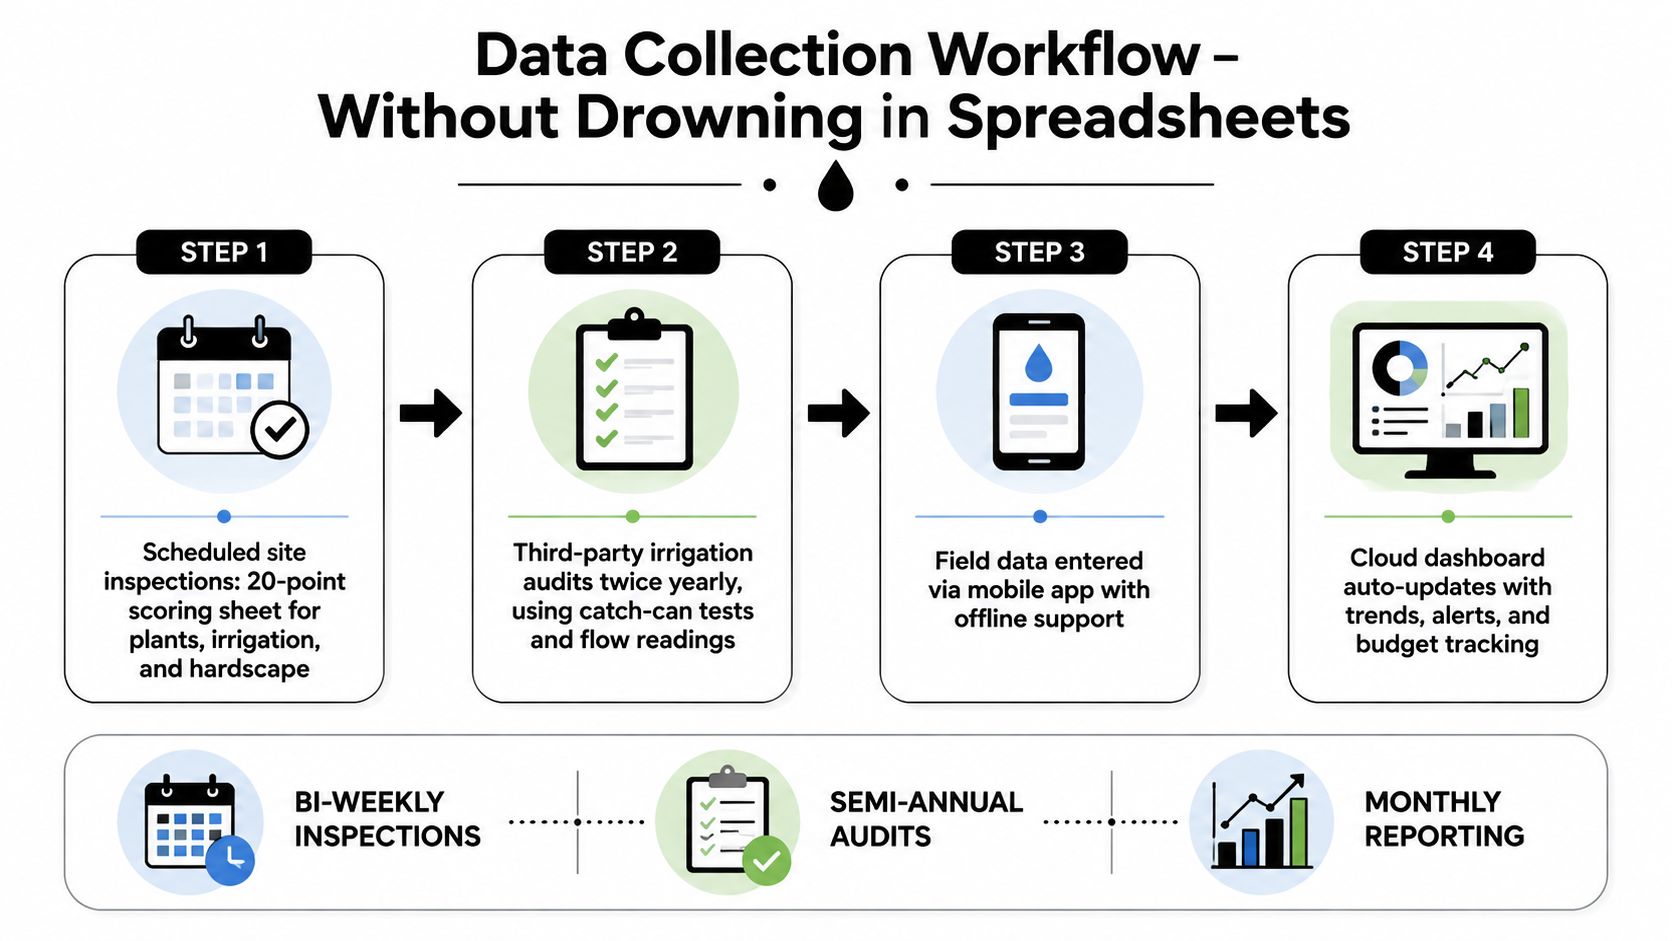
The collection system should fit the operating rhythm of the property. If every measurement requires a separate spreadsheet, manual transcription, and a lengthy narrative, the team will eventually stop updating it. Build a simple chain from field observation to management decision.
Use four connected data inputs
Scheduled inspections: Use a standardized 20-point scoring sheet covering plant condition, irrigation, turf, beds, trees, hardscape, drainage, safety, and visible service defects. Keep the questions stable so trend lines mean something.
Independent irrigation audits: Schedule full audits twice yearly, with additional testing after major repairs, renovations, or unexplained water changes. Catch-can testing, flow readings, pressure checks, and controller review reveal problems that visual inspections miss.
Automated controller records: Pull smart controller schedules, alerts, runtimes, flow data, and weather adjustments into a dashboard where possible. Controller logs validate what the system was programmed to do, but field inspections confirm what the system actually received.
Short customer surveys: Ask a small set of consistent questions each quarter and convert the responses into one satisfaction indicator supported by complaint categories. Don't use surveys to replace inspections. Use them to reveal experience problems your team may not see.
The landscape scheduling software resource can help managers think through how inspections, work orders, route assignments, and follow-up records should connect. The important design choice is ownership. Someone must be responsible for collecting each input, reviewing exceptions, and closing corrective actions.
Set a reporting cadence
- Monthly: Issue an exception report showing water variances, failed zones, open safety items, plant losses, and overdue work.
- Quarterly: Summarize trend direction, appearance, customer feedback, labor efficiency, and completed corrective actions.
- Annually: Review lifecycle costs, replacement patterns, contract scope, irrigation infrastructure, and capital priorities.
A report should answer three questions quickly: what changed, why it changed, and what action comes next. If it can't, reduce the number of displayed metrics and improve the quality of the remaining ones.
Turning Metrics Into Better Landscape Management Decisions
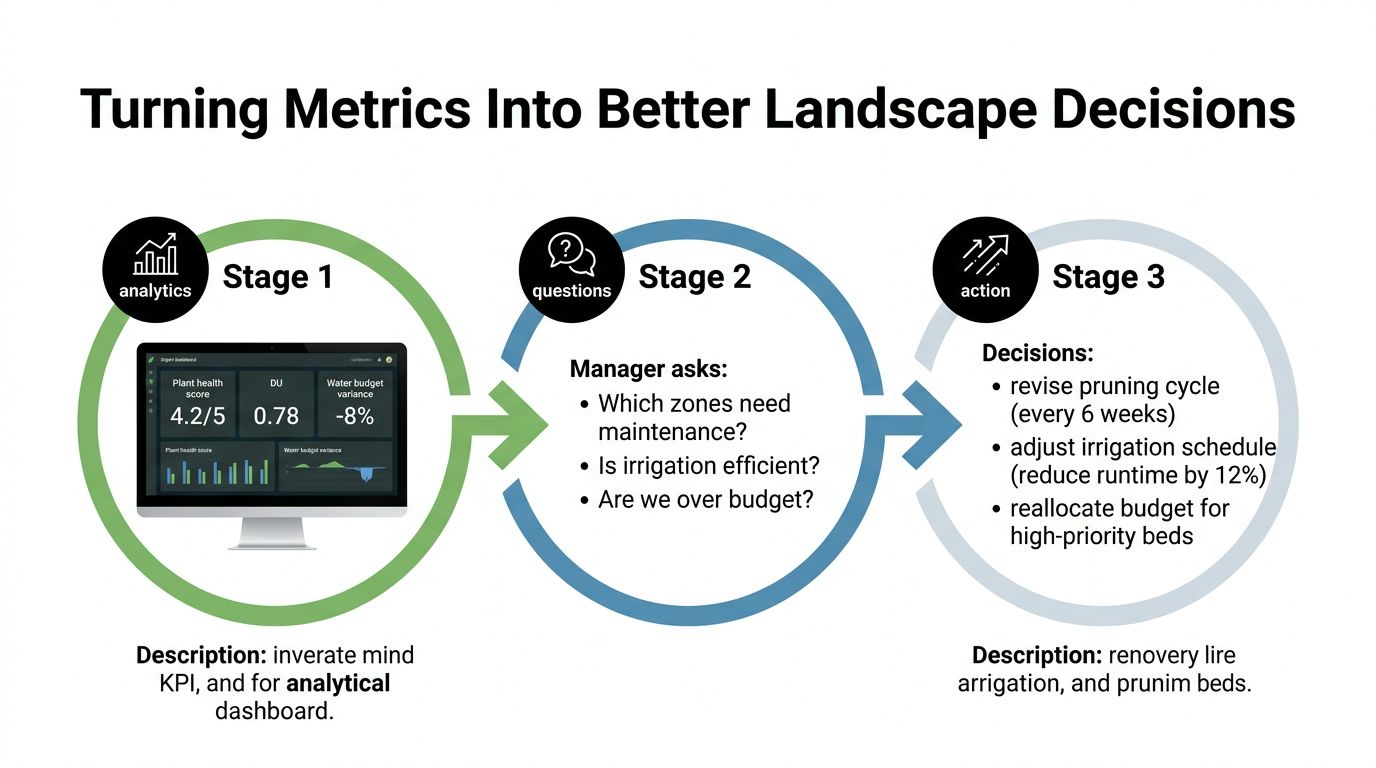
A dashboard earns its keep when it changes the question a manager asks during a site walk. Instead of asking whether the grounds “look okay,” ask which zones are declining, which maintenance tasks are recurring, and which asset condition is likely to create a budget or liability issue.
Connect each metric to a specific response
A low plant health score in a shaded bed may call for a pruning adjustment, soil correction, pest review, or plant replacement plan. Don't automatically increase irrigation. First identify whether the problem is water availability, drainage, compaction, plant selection, or maintenance timing.
A DU failure should lead to targeted irrigation work. Replace or clean the affected heads, correct pressure, repair leaks, and retest the zone. Reprogramming every controller station because one hydrozone performs poorly treats the symptom across the entire property.
Water budget variance requires diagnosis rather than reflexive cutbacks. If applied water exceeds ET-based demand, inspect scheduling and system condition. If use falls below budget while plant health declines, the apparent savings may represent under-watering, broken equipment, or missing data.
Lifecycle metrics change capital conversations. Instead of asking what failed this month, the manager can identify which irrigation assets, tree groups, beds, or hardscape elements are approaching predictable replacement needs. That supports planned funding and reduces emergency work.
Compliance and safety scores should flow directly into contract language. Require inspection frequency, response times, documentation, escalation rules, and closure evidence for recurring hazards. A vendor's report should show not only that an issue was found, but who owns the correction and when the property can expect resolution.
The contrarian answer: watering less isn't automatically a performance win. The right result is reliable plant health, even distribution, controlled loss, budget compliance, and lower avoidable replacement demand.
Metrics aren't a reporting exercise. They're a decision system that lets you walk the property with a clipboard full of answers instead of guesses. Start with seven indicators that predict the next season: zone-level DU, water budget variance, plant health, aesthetic condition, maintenance productivity, lifecycle replacement pressure, and safety or compliance exceptions. Add satisfaction when occupant experience is a material asset priority.
If your commercial property needs irrigation audits, maintenance benchmarking, responsive repairs, or a practical performance dashboard, Prestonwood Commercial Landscape Services can connect field inspections, smart water management, horticultural care, and proactive recommendations to the metrics that matter. Visit Prestonwood Commercial Landscape Services to discuss a performance program for your property.